


How the stack works
The stack (which we talked about in the article on memory management) has a LIFO (Last In, First Out) structure.
LIFO
This means that the last element placed on the stack will be the first element to be popped off. To better understand, we can imagine a stack of plates. If we stack plates on top of each other, we will need to remove the last plate placed, then the second to last, and so on, in order to retrieve the first plate placed. It’s the same principle.
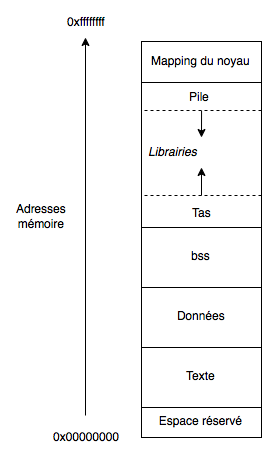
Unlike the stack of plates, the stack piles up its elements downwards. So what we call the top of the stack is actually the lowest address of the stack. The more values we push onto the stack, the more the addresses decrease. It’s confusing, but you get used to it quickly!
Stackframe
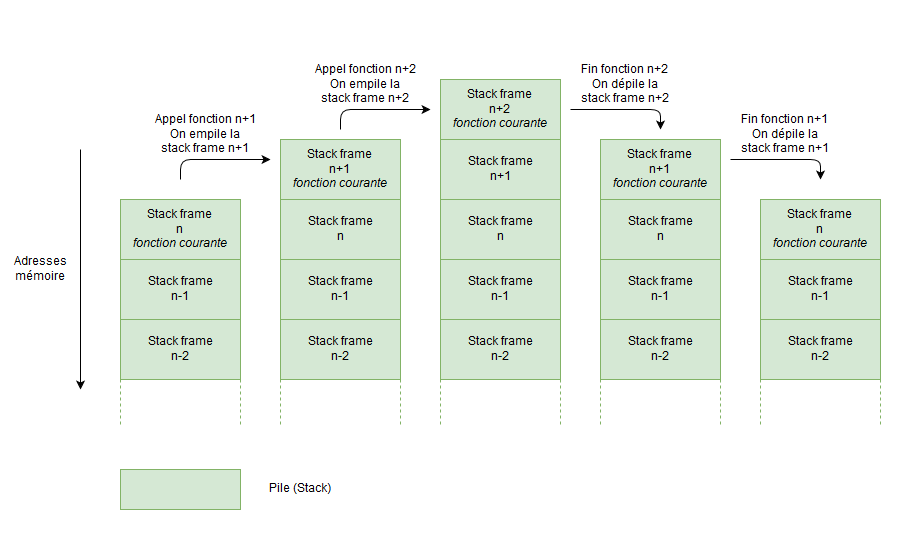
This LIFO structure is, in fact, extremely useful. Indeed, when a function is called, all the data needed for the execution of the function, as well as for the return to the initial state, are pushed on. Once the function is finished, we therefore have to return to the line following its call, and this is done by popping everything that was previously pushed, leaving the rest of the stack and the other possible stack frames intact. Here is a diagram that tries to summarize what I’m saying:
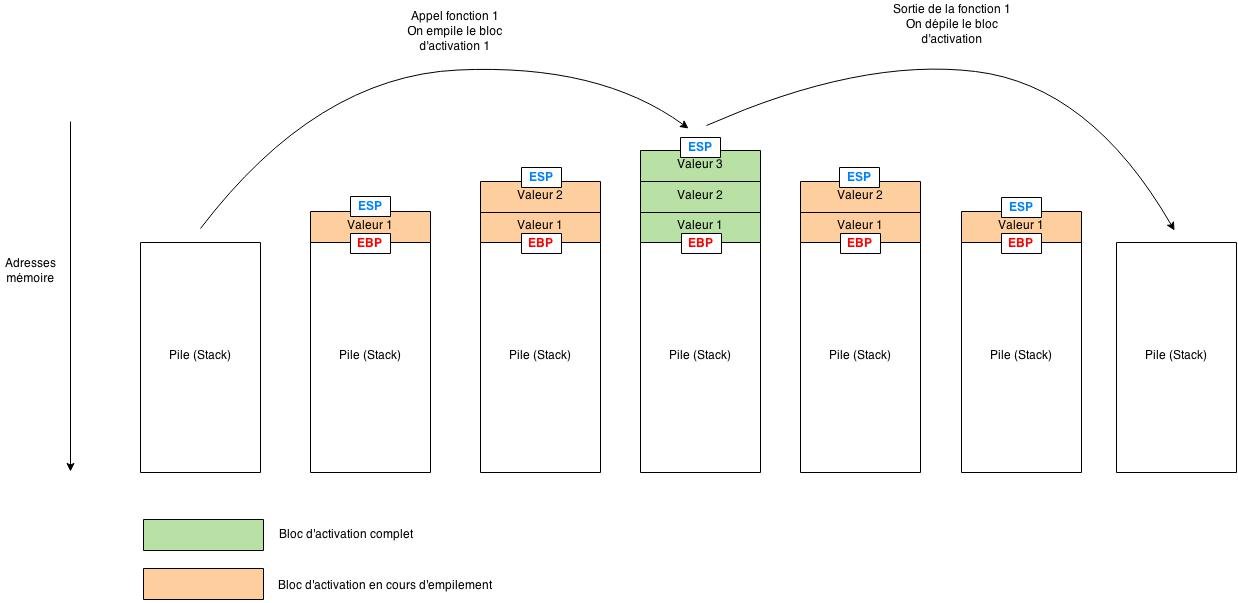
We saw in an article on memory management what stack frames were (you know, that information stored on the stack when a function is called to save the execution context as well as the variables passed to the function). Well, the ESP register keeps in memory the address of the top of the stack (so the lowest address, since the more the stack grows, the lower the new addresses). It is therefore updated each time the stack is modified (adding a value or removing the last value). The EBP register keeps in memory the address of the beginning of the stack frame. Thus, the current stack frame is located between the address contained in EBP and the address contained in ESP.
Here is a diagram that illustrates the role of the EBP and ESP registers:
What we have just seen is true as long as we stay in the same stack frame. However, what happens when there is a call to a new function? Once this new function is finished, how does the processor return to the previous state? That is what we are going to see right now.
Prologue - Epilogue
In order to fully understand the rest of this article, basic assembly notions are useful. Although it is possible to follow without any knowledge, it is strongly recommended to read the article Assembly basics which will give you the necessary basics for a better understanding.
Consider the following fonction.c program:
#include <stdio.h>
#include <stdlib.h>

int reponse(int a, int b, int c) {
    return a+b+c;
}

int main() {
    int result;
    result = reponse(4, 8, 42);
}
After compilation, we disassemble the main function to see the assembly instructions that compose it
hackndo@becane$ gcc fonction.c -o fonction
hackndo@becane$ gdb -q fonction
Reading symbols from /home/hackndo/fonction...(no debugging symbols found)...done.
(gdb) disas main
Dump of assembler code for function main:
    0x080483a5 <+0>:     push   ebp
    0x080483a6 <+1>:     mov    ebp,esp
    0x080483a8 <+3>:     sub    esp,0x1c
    0x080483ab <+6>:     mov    DWORD PTR [esp+0x8],0x2a
    0x080483b3 <+14>:    mov    DWORD PTR [esp+0x4],0x8
    0x080483bb <+22>:    mov    DWORD PTR [esp],0x4
    0x080483c2 <+29>:    call   0x8048394
    0x080483c7 <+34>:    mov    DWORD PTR [ebp-0x4],eax
    0x080483ca <+37>:    leave
    0x080483cb <+38>:    ret
End of assembler dump.
If you didn’t have time to look at the article on the basics of assembly, let’s quickly recall the role of the commands we used.
The gcc (GNU Compiler Collection) command is a command on Linux that historically allowed to compile programs written in C, but which now allows to compile programs in different languages (C, C++, Java…).
gdb (GNU Project Debugger) is a powerful debugger, completely command-line based. It allows, among other things, to disassemble a program, to launch it, to pause it during its execution, to read memory, to modify it during execution, and so on. You can also read the article Introduction to GDB to better understand how it works.
Tip: When we are in a gdb session, it is possible to pass it a large number of commands. As some of them can have very long names, or can be called extremely often, some abbreviations can be used. For example, the command to get information about the registers is info registers but it can be launched using the simple i r command.
To disassemble a function of a program loaded in gdb, we pass it the disassemble function command. Here we wish to disassemble the main function, so we run the disas main command, knowing that disas is an alias for disassemble, as we just explained.
We notice various things. First of all, we see the call to the reponse function on line +29 (address 0x080483c2) with the call instruction. Then we notice on the 3 previous lines that they are the addition on the stack of the arguments that will be sent to this function: The 3rd argument is placed, then the second, and finally the first.
Once we arrive at the call instruction, let’s look at the state of the stack:
(gdb) x/8xw $esp
0xbffffc9c:    0x00000004    0x00000008    0x0000002a    0x080483eb
0xbffffcac:    0xb7fd6ff4    0x080483e0    0x00000000    0xbffffd38
In order to read this information, let me remind you that the stack grows towards low addresses. The first line that we can read begins with 0xbffffc9c followed by 4 groups of 4 bytes. The first group is indeed at the address 0xbffffc9c, the next group 4 bytes further is therefore at 0xbffffca0, then the group is at 0xbffffca4 and finally the last group of the first line is at the address 0xbffffca8. We then move on to the next line, and we move forward again by 4 bytes, which gives us indeed the address 0xbffffcac and so on.
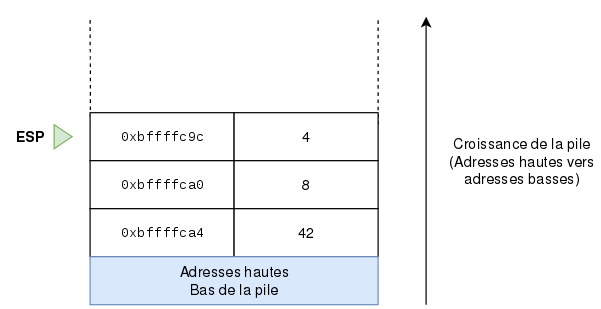
The ESP register points to the “top” of the stack, so to the address 0xbffffc9c. As we have prepared for the function call, the top of the stack (pointed to by ESP) is composed of the arguments that are passed to the function. We can clearly see the values 4, 8 and 42 (0x2a in hexadecimal).
The stack is therefore in the following state:
The arguments are therefore saved on the stack. But once the program enters the function, it will have to remember where it came from. And for that, it will have to save the EIP register (which is the register that has in memory the address of the current instruction). However, we don’t see any PUSH EIP instruction in the code, simply for the following reason (which is imperative to remember), which is that the call instruction is an alias for the following two instructions:
push EIP
jmp <address of the function>
So if we move forward one instruction to enter the function, the value of EIP is pushed onto the stack, and we get:
(gdb) stepi
0x08048394 in reponse ()

(gdb) x/8x $esp
    0xbffffc98:    0x080483c7    0x00000004    0x00000008    0x0000002a
    0xbffffca8:    0x080483eb    0xb7fd6ff4    0x080483e0    0x00000000
We see the address 0x080483c7 arriving at the top of the stack. Do you notice what it is? Yes, it’s the address of the instruction following the call in main. At the moment of entering the function, the processor saves the next instruction to be followed once it exits the function it has just entered.
With this save of EIP, we therefore have a representation of the stack as follows:
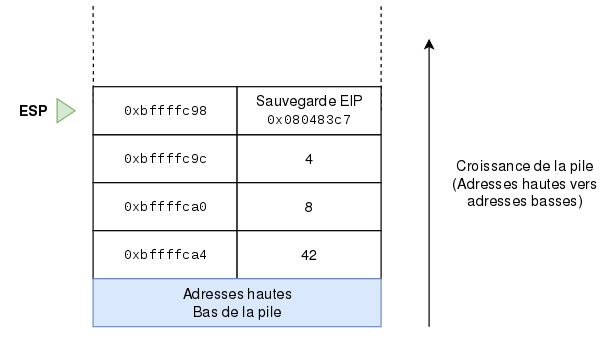
There we go, we have made the jump. We are at the first instruction of the reponse() function.
But as a result, this new function must have its own space on the stack. Its stack frame must be dissociated from that of the main function.
Indeed, let’s recall that each function has its own stack frame. When a function is called, it will reserve a space at the top of the stack. Below this space is the stack frame of the calling function. When the current function is finished, we will have to be able to return to the calling function.
For this, each function has what is called a prologue and an epilogue. The prologue allows to save the information of the calling function and to reserve the space on the stack that the function will need, while the epilogue allows to restore this saved information so that the calling function can resume its course of execution as if nothing had happened.
Let’s take the code of the reponse function to see in detail how it works.
(gdb) disas reponse
Dump of assembler code for function reponse:
    0x08048394 <+0>:    push   ebp
    0x08048395 <+1>:    mov    ebp,esp
    0x08048397 <+3>:    mov    eax,DWORD PTR [ebp+0xc]
    0x0804839a <+6>:    mov    edx,DWORD PTR [ebp+0x8]
    0x0804839d <+9>:    lea    eax,[edx+eax*1]
    0x080483a0 <+12>:   add    eax,DWORD PTR [ebp+0x10]
    0x080483a3 <+15>:   pop    ebp
    0x080483a4 <+16>:   ret
End of assembler dump.
The prologue of this function consists of lines +0 and +1.
We see in order that EBP is pushed onto the stack with PUSH EBP, allowing to save the EBP register on the stack, register that pointed to the beginning of the previous stack frame. On line +1, the value of ESP is copied into EBP. At that moment, EBP and ESP point to the same memory cell. This is normal, we just started the stack frame of the called function, and it hasn’t put anything on it yet. So the beginning and the end are merged!
By the way, if we look at the evolution of the EBP and ESP registers as well as the stack during the execution of the first instructions of the reponse() function, we get this:
(gdb) disas reponse
Dump of assembler code for function reponse:
=> 0x08048394 <+0>:     push   ebp
   0x08048395 <+1>:     mov    ebp,esp
   0x08048397 <+3>:     mov    eax,DWORD PTR [ebp+0xc]
   0x0804839a <+6>:     mov    edx,DWORD PTR [ebp+0x8]
   0x0804839d <+9>:     lea    eax,[edx+eax*1]
   0x080483a0 <+12>:    add    eax,DWORD PTR [ebp+0x10]
   0x080483a3 <+15>:    pop    ebp
   0x080483a4 <+16>:    ret
End of assembler dump.

(gdb) i r $ebp $esp
ebp            0xbffffcb8    0xbffffcb8
esp            0xbffffc98    0xbffffc98

(gdb) continue
Continuing.

Breakpoint 1, 0x08048397 in reponse ()

(gdb) disas reponse
Dump of assembler code for function reponse:
   0x08048394 <+0>:     push   ebp
   0x08048395 <+1>:     mov    ebp,esp
=> 0x08048397 <+3>:     mov    eax,DWORD PTR [ebp+0xc]
   0x0804839a <+6>:     mov    edx,DWORD PTR [ebp+0x8]
   0x0804839d <+9>:     lea    eax,[edx+eax*1]
   0x080483a0 <+12>:    add    eax,DWORD PTR [ebp+0x10]
   0x080483a3 <+15>:    pop    ebp
   0x080483a4 <+16>:    ret
End of assembler dump.

(gdb) x/8xw $esp
0xbffffc94:    0xbffffcb8    0x080483c7    0x00000004    0x00000008
0xbffffca4:    0x0000002a    0x080483eb    0xb7fd6ff4    0x080483e0

(gdb) i r $ebp $esp
ebp            0xbffffc94    0xbffffc94
esp            0xbffffc94    0xbffffc94
Let’s go through this code step by step: We are at the beginning of the instructions of the function, ready to execute the push ebp. We see that EBP contains the address 0xbffffcb8 and esp contains 0xbffffc98. We indeed find the ESP that we had represented on the last diagram. Then, we move forward by two instructions. We then look at EBP and ESP. They are indeed equal, as expected. We have pushed the old value of EBP onto the stack, which has shifted the top of the stack by 4 bytes. The top of the stack is therefore 0xbffffc98 - 4 so 0xbffffc94. Then, we assign ESP to EBP. ESP now being 0xbffffc94, EBP takes the same value, as shown by the last command of this sequence. Here is a final diagram that represents the current state of the stack:
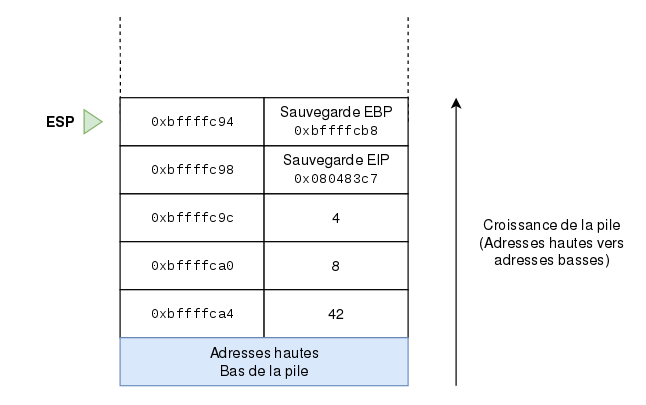
That’s it for the explanation of these lines in gdb. Then we have a few instructions that perform the requested calculation, then we arrive at the last two lines, which are pop ebp and ret.
The first will allow to put the EBP pointer back at the beginning of the stack frame of the calling function, while the second allows to POP EIP (so return the save of EIP into the EIP register) in order to resume the course of the instruction that was following the function call. This routine can be summarized very briefly by the following diagram:
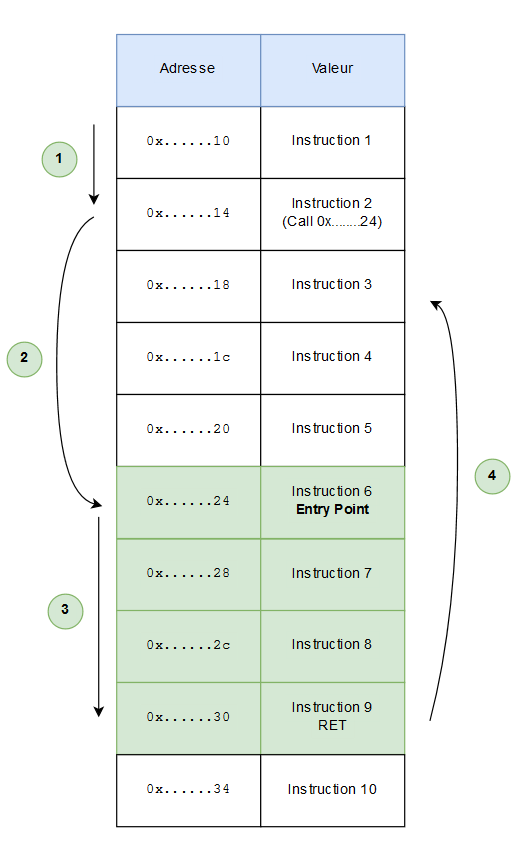
The program is read instruction by instruction (1). During a call (2), the current instruction is pushed (EIP is pushed onto the stack), then we jump to the address given by the call. Here, the instructions of the function are executed one after the other up to the RET (3) which will retrieve the value of EIP saved previously, in order to return to where the program was (4), without losing the thread!
Magic, isn’t it?
With this slightly more detailed understanding, you are able to understand the concept of buffer overflow, explained in the article Buffer Overflow