
BloodHound
BloodHound is a tool for visualizing an Active Directory environment as a graph. This representation then offers all the power of graph theory to unravel new attack paths that otherwise would have been difficult or impossible to detect.
Active Directory
In an Active Directory environment, access rights management is complex, very complex. It is not uncommon for a user to be part of a group, which is part of 10 other groups, and that one of these groups has the right to modify a GPO which applies to an organizational unit that contains users with administrative rights on a set of hosts. That could go forever.
The issue is that as the administrator of a complex information system these delegations of access rights are extremely complex to detect. Administrators usually look at some access lists that a user or a group has on a particular object. Sometimes there are dozens of different rights that can be applied to an object.
Here is an example of a list of ACE (Access Control Entry) that can be found on a “GPO” object.
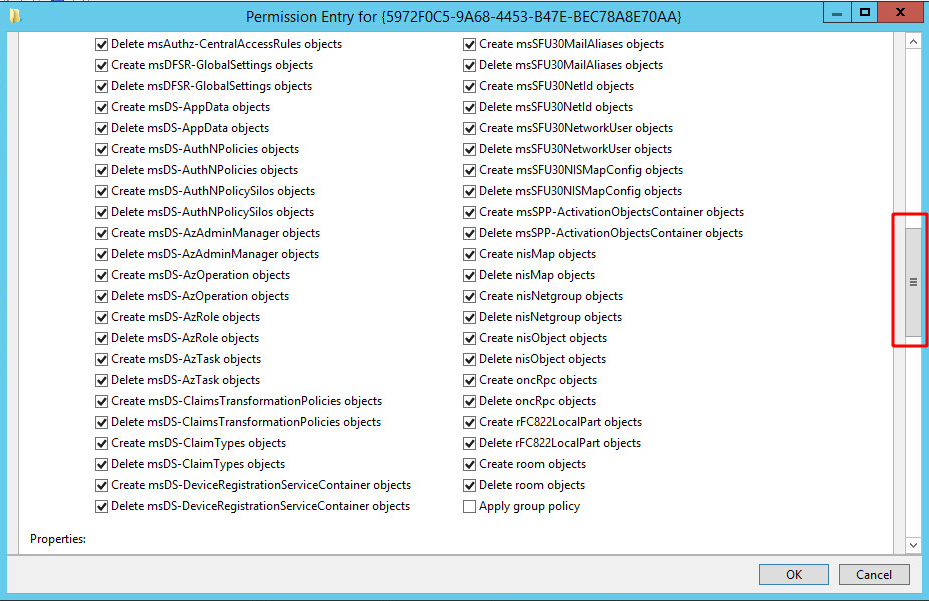
The scroll bar on the right shows that there is a very large number of possible entries. Think about the fact that there are entries like these on all objects in the Active Directory, that some of these rights can be applied via delegation, that there are groups included in other groups, inheriting their parent groups rights and so on.
This is the issue BloodHound is trying to solve. When working with lists is a nightmare, working with graphs is way more effective.
BloodHound
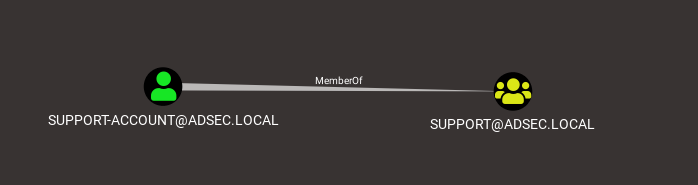
BloodHound is a tool developed by @wald0, @Harmj0y and @CptJesus. The idea of this tool is to analyze an Active Directory environment by enumerating its various objects, and by linking them with some relationships. For example, if the user support-account is a member of a group called support, the user will be linked with the relationship MemberOf to this particular group.
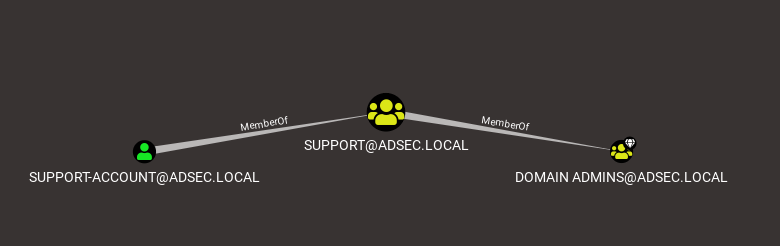
It’s quite easy to visualize this kind of relationship. Something is a MemberOf something else, but it doesn’t stop there. It also lets you visualize that the support group is a member of the Domain Admins group, which means that the support-account user is also member of the Domain Admins group.
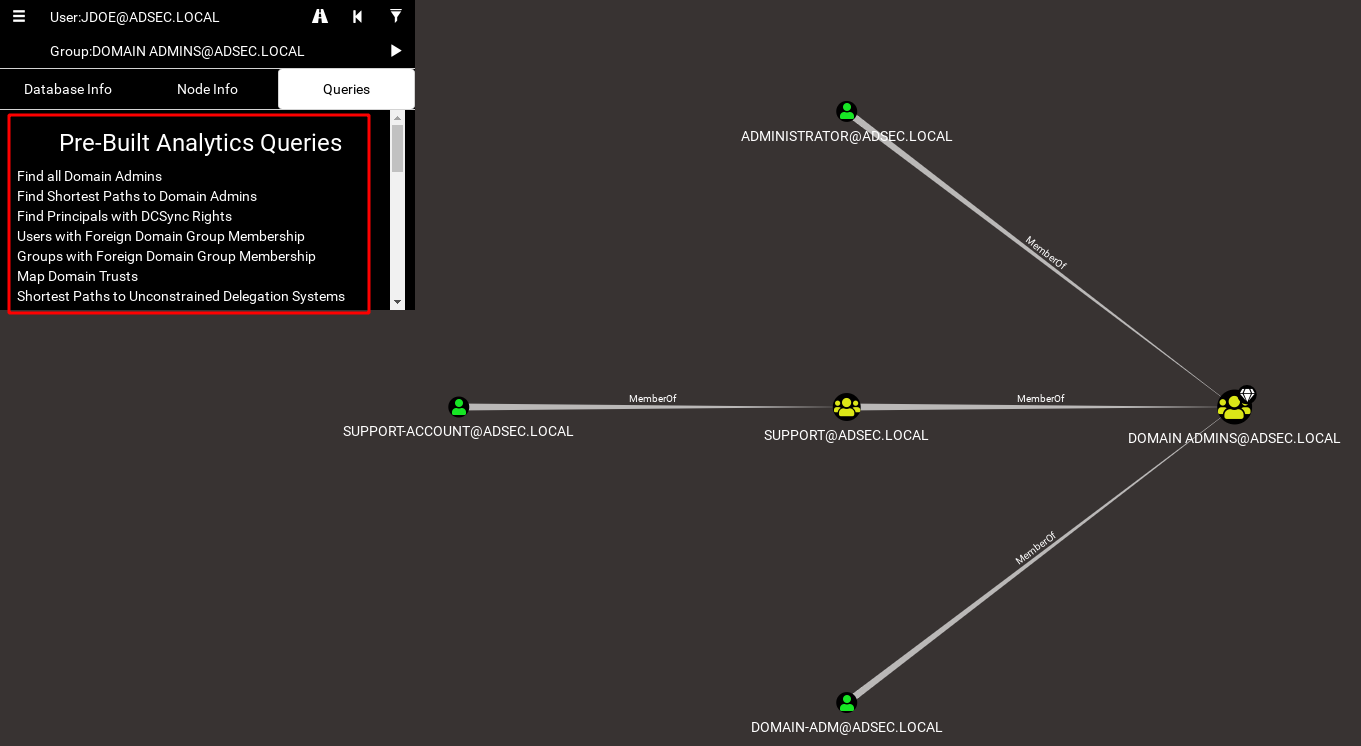
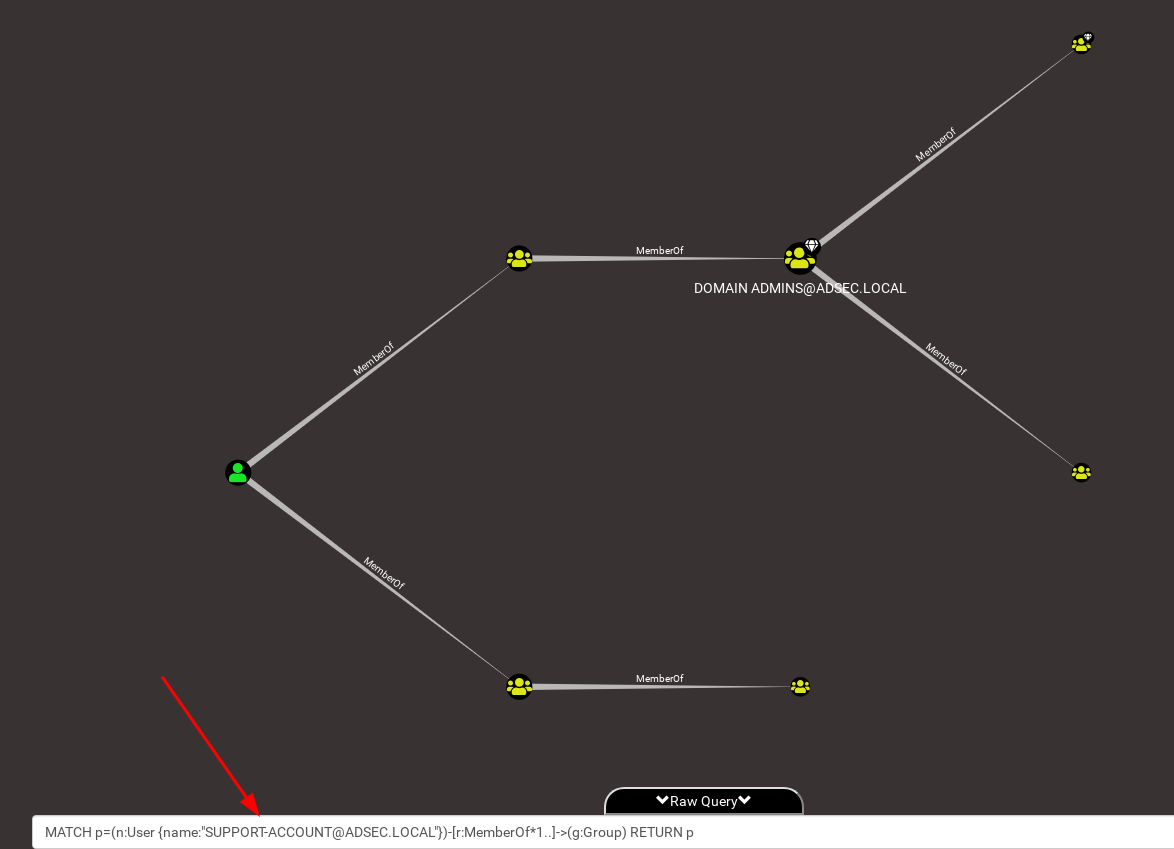
That’s not it! If we ask to display all the groups that support-account is a member of, we realize that there is a lot more!
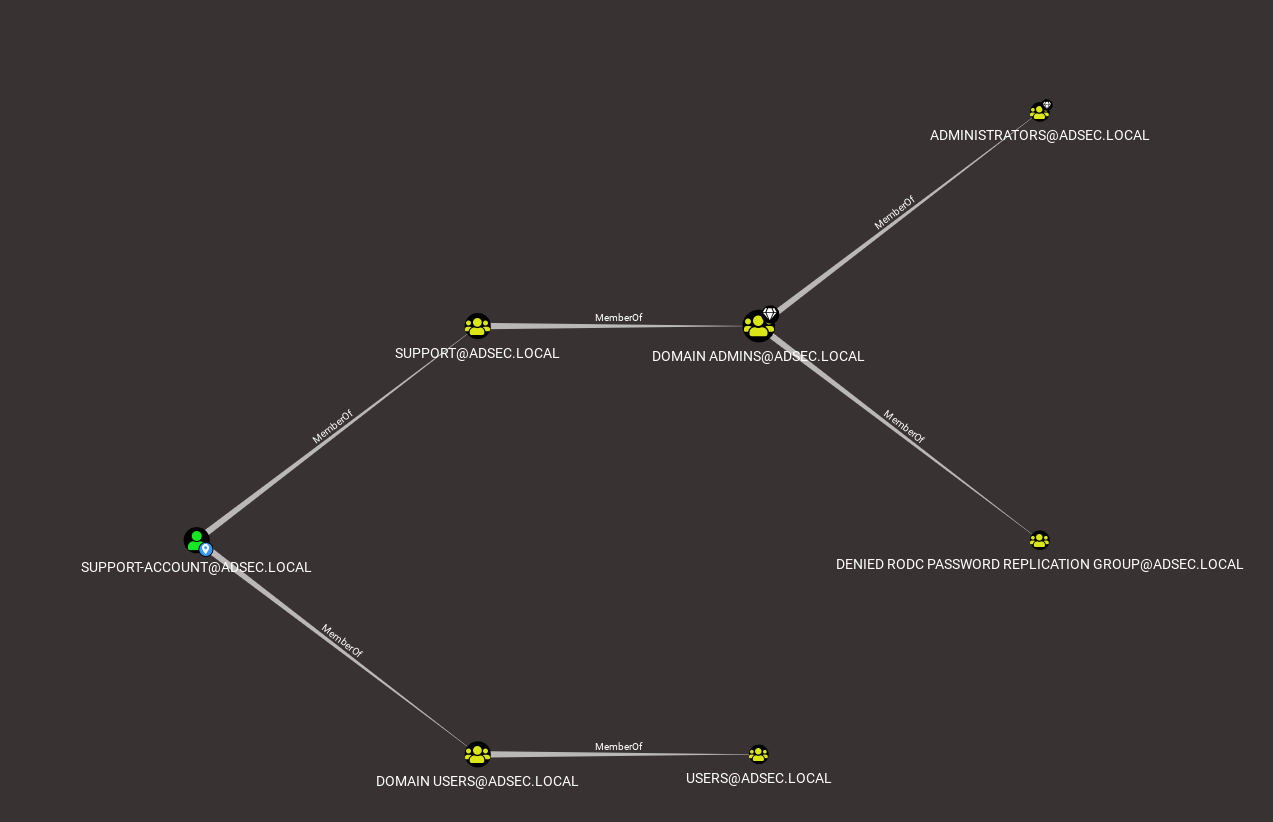
And that’s only the MemberOf relationship. There are plenty of others. As of today, here is the list of all available relationships.
Ok, so now we have a set of objects linked together with relationships. Now it’s possible to find some attack paths using graph theory.
But wait. What is graph theory?
Graph theory
Graph theory is based on a “graph” representation of the data. It is made up of nodes (here the objects in Active Directory) and edges (here the relations between the objects).
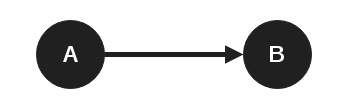
In graph theory, edges can be directed, which is the case with BloodHound. This means that to go from node A to node B, they must be connected by an edge going from A to B. The other way does not work.
Once we have all these nodes connected by edges, we can look for particular paths to start from a node and arrive at a destination node, passing through a whole set of other nodes. There are often several possible paths, and graph theory makes it possible to find the shortest paths that connect two particular objects.
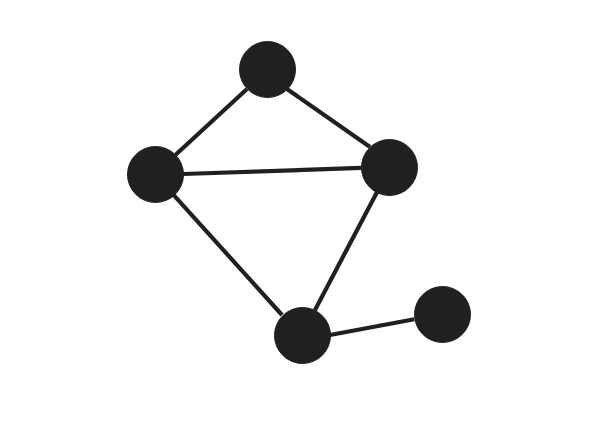
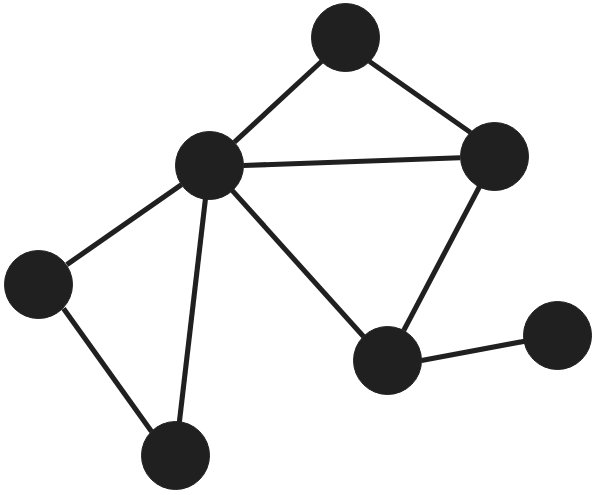
The following graph consists of 7 nodes and 9 edges.
If we managed to take control of the leftmost node, and we wish to reach the rightmost node because it is the Domain Admins node, graph theory allows us to find the shortest path between these two.
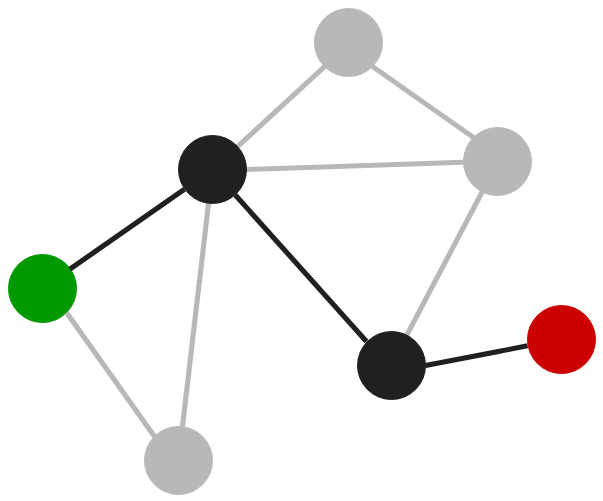
An attacker with this information will know how to move through the network to reach his objective in a minimum number of steps.
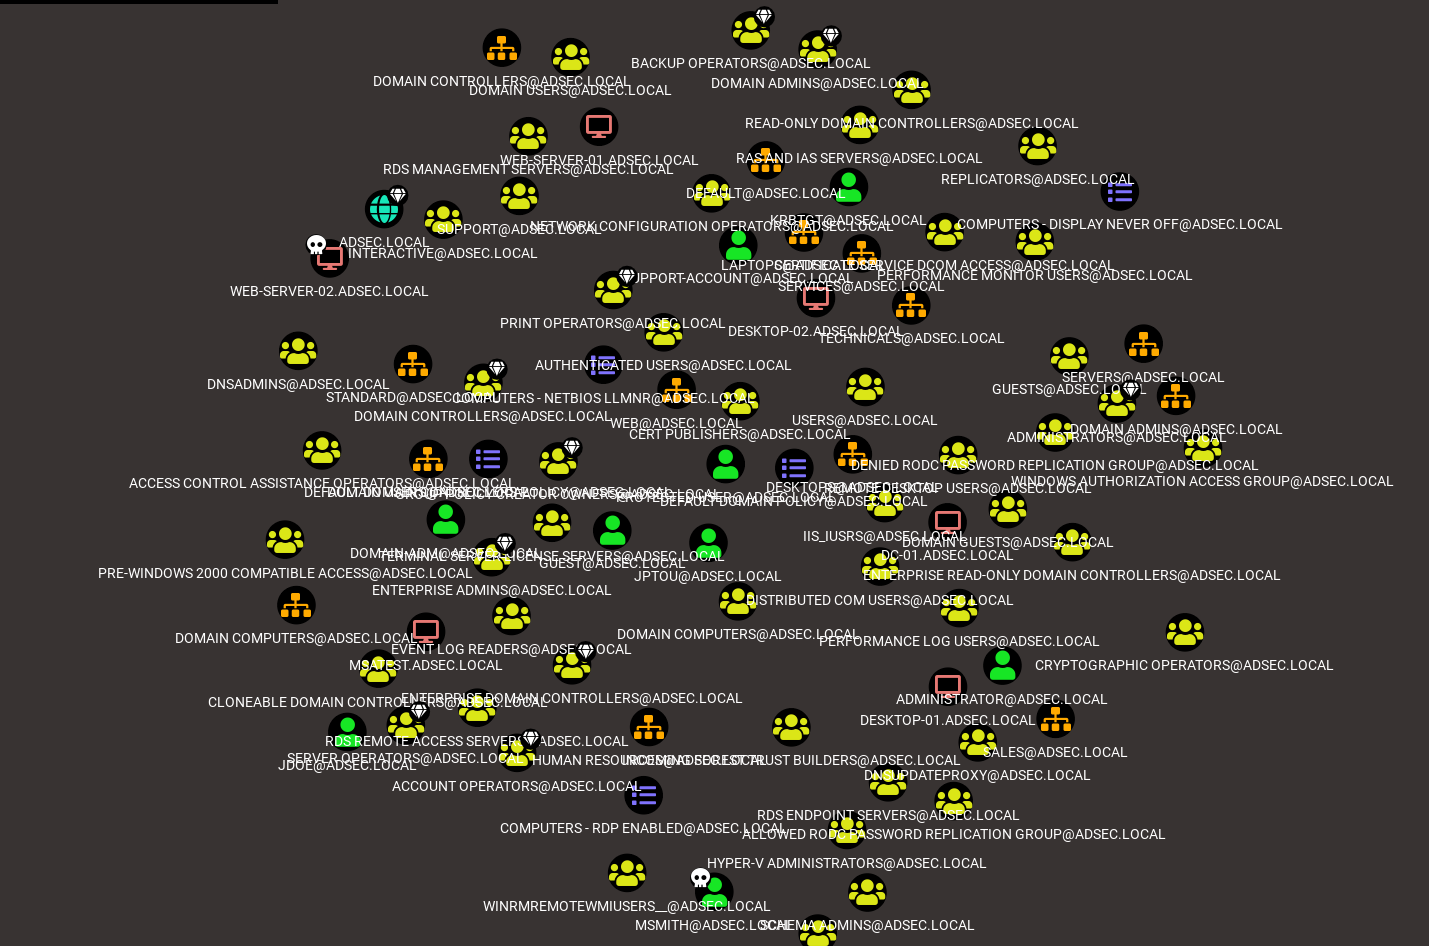
Take for example a real Active Directory environment. It is made up of numerous nodes.
If we compromise jdoe user, this is the shortest path to reach the Domain Admins group.
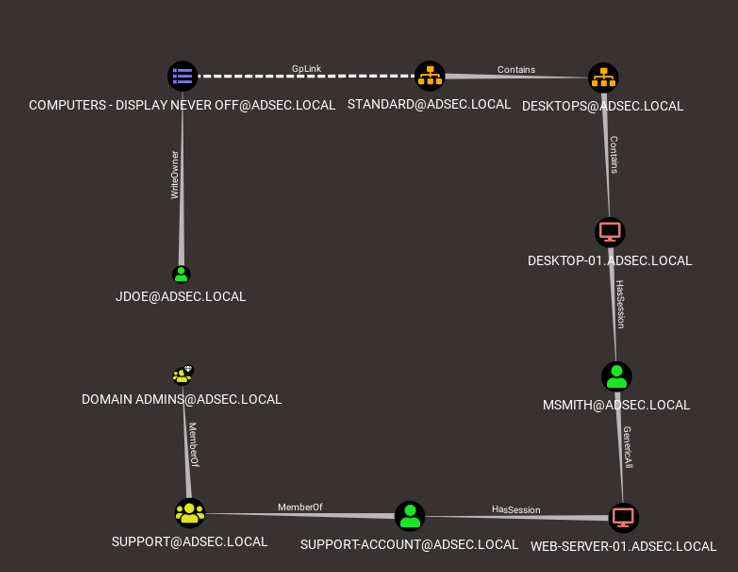
As we can see, the “shortest” path is quite long, which suggests the environment is quite complex. Despite this complexity, using BloodHound allows one to simply and clearly extract an attack path from a user who didn’t seem to have any special access rights.
In order to be able to use graph theory, BloodHound uses “Neo4j” graph oriented database to store Active Directory data.
How does it work?
BloodHound collects data using different techniques:
First, in order to collect directory data, it is necessary to request it from a domain controller. If we have a domain account, even if it has no particular rights, we can browse by default all the users, hosts, GPOs, ACLs, and other information in the directory.
Furthermore, until recently, it was possible to ask the various hosts for the list of their local groups, which made it possible to know who was local administrator of which host by correlating this information with the membership of the users in the different groups.
Then we are able to enumerate the remote sessions on the hosts using the command line net session \\computer. This is an output example:
net session \\computer

Computer      User name                Client type  Opens   Idle time
---------------------------------------------------------------------
\\SOURCE      SUPPORT-ACCOUNT          Windows 7    1       00:00:13
This command lets you know that the user SUPPORT-ACCOUNT requested a resource on computer from the host SOURCE. This information confirms that SUPPORT-ACCOUNT currently has an active session on SOURCE. This is important information since it indicates that the credentials of support-account should be in lsass memory on SOURCE.
These different pieces of information (not exhaustive) are collected with the SharpHound ingestor, and are saved in json format in different files.
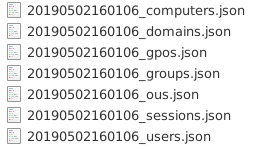
These files are then imported into BloodHound, which stores them in the Neo4j database. Once the import is complete, the BloodHound graphical interface allows you to quickly visualize this data via built-in or custom cypher queries.
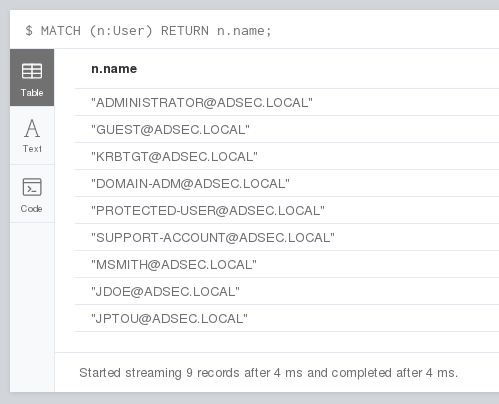
It is also possible to send requests directly to the Neo4j interface, which can be useful for extracting data in table format.
Requests
Beyond the built-in requests proposed by BloodHound, it is possible to write your own requests. I’m not going to write a tutorial about this here: CptJesus wrote BloodHound: Intro to Cypher which describes in detail how this works.
You can also go read the paper from SadProcessor called The Dog Whisperer’s Handbook which talks about BloodHound and introduces the cypher query language.
You should also know that it is possible to activate the “debug” mode in BloodHound which displays the raw cypher queries executed when you click on a button in the graphical interface.
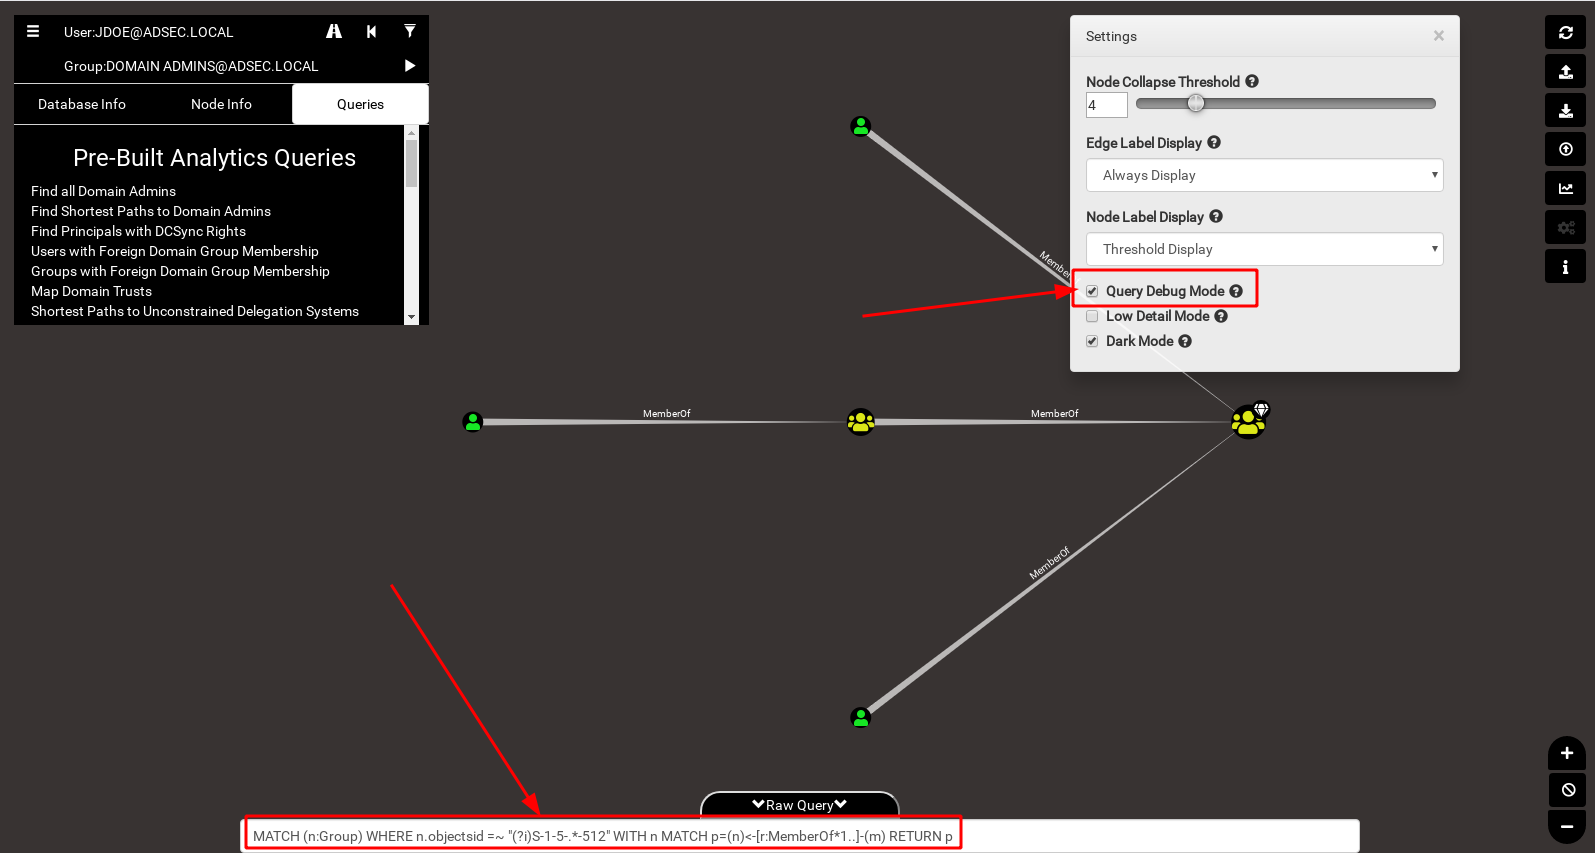
This query can then be used in Neo4J if needed.
For lazy people that didn’t read the posts I linked above, here’s a quick overview of a cypher query.
MATCH p=(n:User {name:"SUPPORT-ACCOUNT@ADSEC.LOCAL"})-[r:MemberOf*1..]->(g:Group) RETURN p
This query lists all the groups the user support-account is a member of. It can be split in two.
The first part MATCH indicates what we are looking for. What we find between parentheses indicates the nodes, and between square brackets the relationship.
We are therefore looking for a node n of type User having a relationship r of type MemberOf to a node g of type Group. The content between curly braces allows you to apply a filter, here a filter on the name SUPPORT-ACCOUNT@ADSEC.LOCAL.
In the relationship part between square brackets, we indicate that this relation must be present one or more times (* 1..).
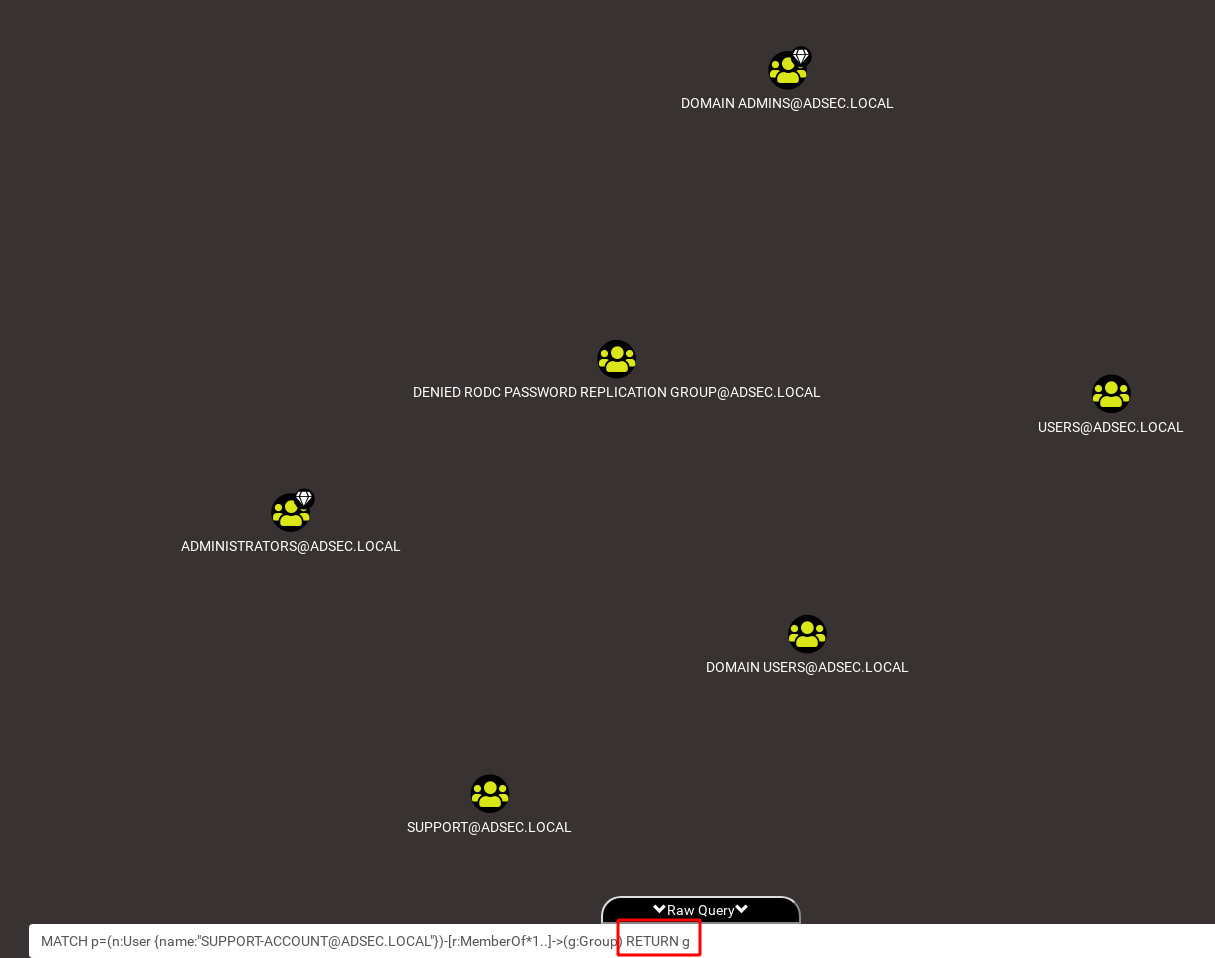
The second part RETURN indicates what we want to return. Here, we want to return the whole pattern assigned to the p variable.
We could have decided to only list the different groups without displaying the relationships or the users. We just need to return the g nodes.
For more complex queries, the posts I linked before will help you go deeper.
Tips & tricks
Here is a list of some little tips or information that may be important or useful.
Dark mode
The first, and by far the most important, is the dark mode of the graphical interface!
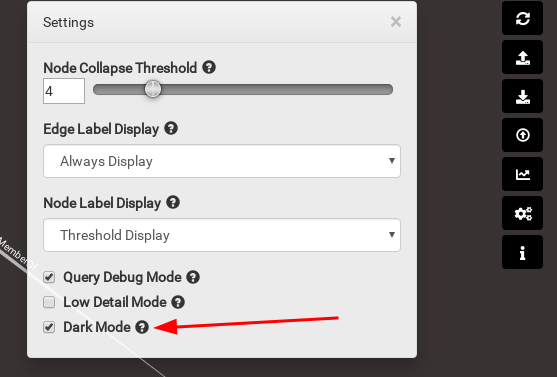
This mode allows you to have a dark and classy interface, which is super nice. That’s it, it’s beautiful, but that’s it.
Right click on edges
When there is a relationship between two nodes, you can “right click” the relationship and a pop-up will display a lot of extremely useful information.
You do not know how to use the GenericAll link?
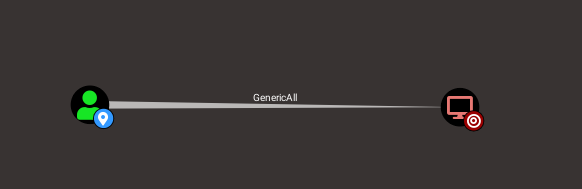
No problem, right clicking the edge will display the tooltip.
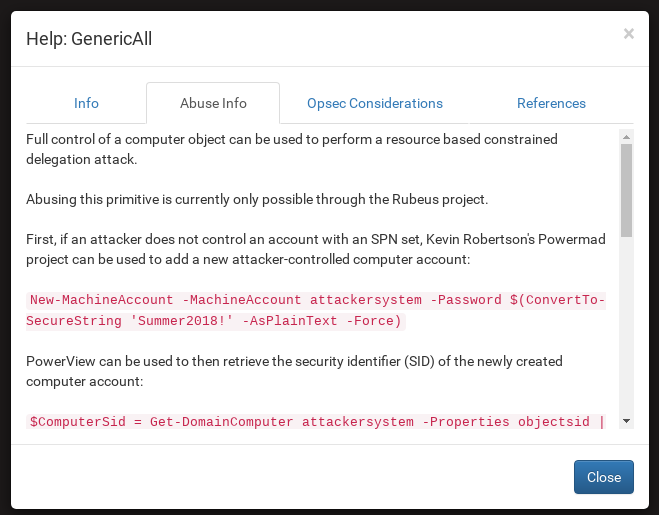
It contains all the necessary information to take control of the destination host.
Owned
During your penetration test, you will compromise hosts, users, groups. You can mark the objects as “owned” after a right click on them to keep track of your progress.
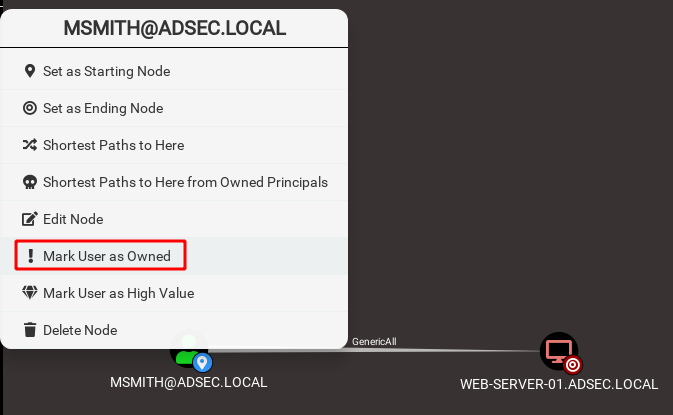
A skull icon will mark these objects afterwards.

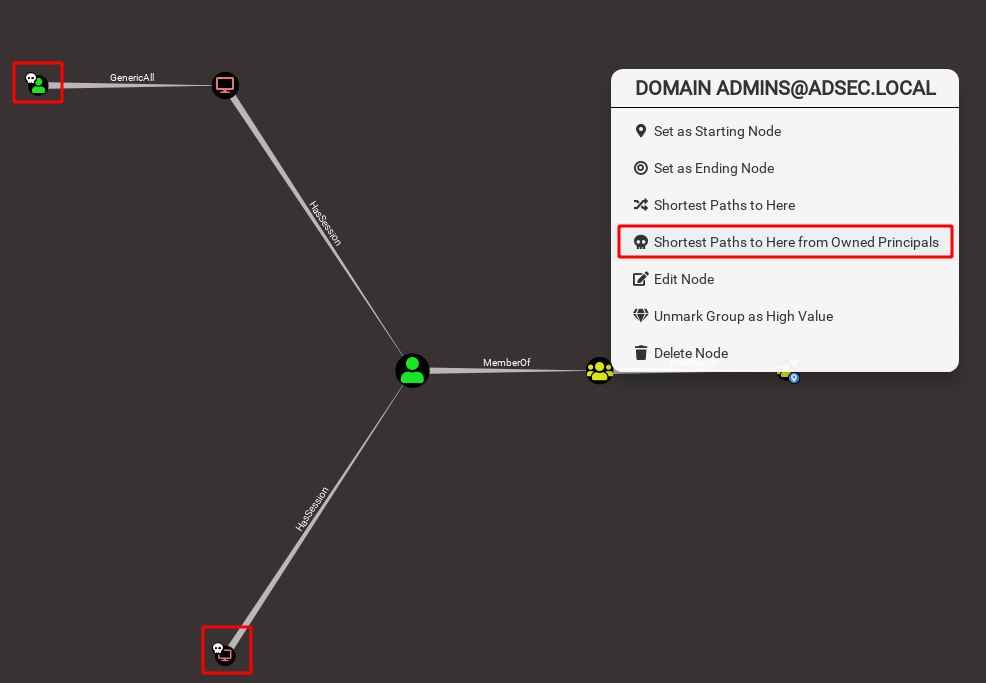
If you are trying to compromise a particular node, you can now request the shortest attack path from the nodes you have already compromised. Neat.
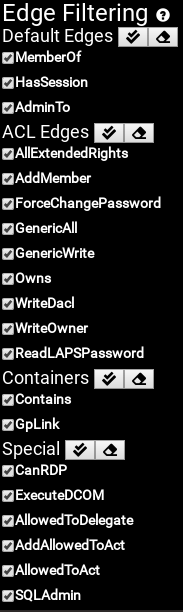
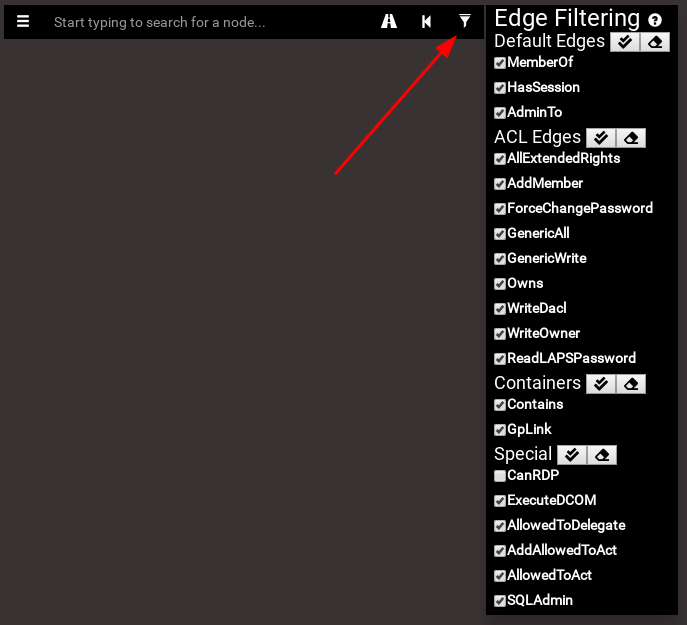
Filters
If you do not want to display certain paths because there are relationships that you cannot exploit, or because you do not have the time, or any other reason, you can decide to uncheck the relationships you do not want to use so that they no longer appear in your queries. To do this, simply click on the filter button to the right of the search bar, and check or uncheck the edges that you want.
Shortcuts
There are a few shortcuts that can be useful when using BloodHound. If you know others, don’t hesitate to share them.
- CTRL: Allows you to display or hide node and relationship labels.
- CTRL + SHIFT + I: Displays the developer tools. If you have a bug in the interface, the javascript console will often allow you to understand the root cause of the issue.
- CTRL + R: Reloads the display
- SPACE: Pops up a table that lists all currently displayed nodes. That’s very convenient if you want to export some query’s results into Excel or something.
Editing
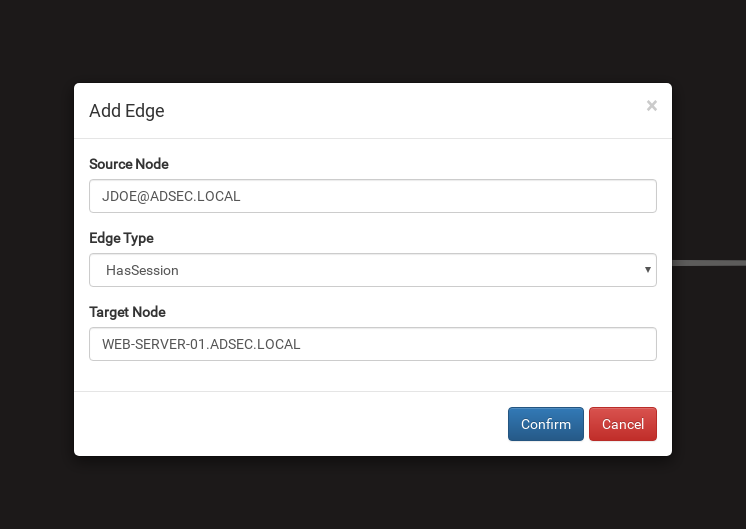
During data collection, your computer was part of the collected hosts and you do not want to see it? You have logged on to a machine, but the “HasSession” link of the Domain Administrator is no longer effective since this machine has restarted? On the contrary, another user is connected on this machine?
Once the data has been imported into BloodHound, it is not frozen. You can modify it as you wish, either by right-clicking on an object or relationship to delete it, or by right-clicking in the background to add a node or relationship.
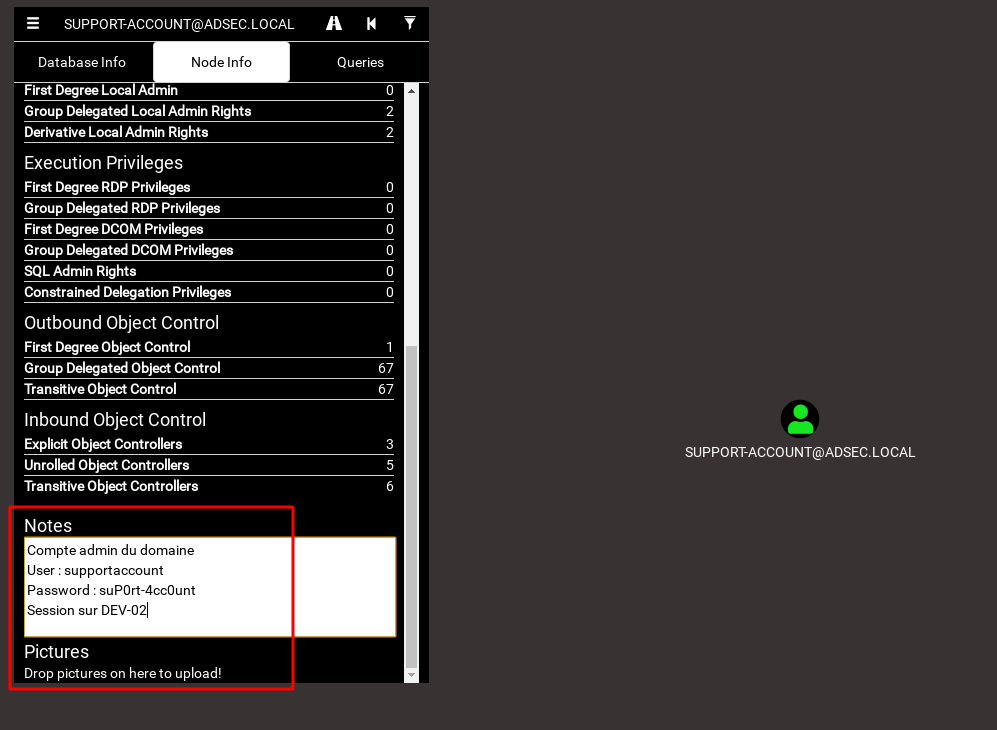
Notes & Screenshots
You can also save information on objects in Active Directory by left clicking on them and going to the “Notes” section in the BloodHound interface.
BloodHound Analytics
Finally, the same team that developed BloodHound also released some tools to create statistics out of a BloodHound extraction. They are available on their Github, including the bloodhoundanalytics.pbix template that uses Microsoft’s free software PowerBI.
Here is an example taken from Wald0 tweet, which shows a PowerBI dashboard using the template provided on the Github.
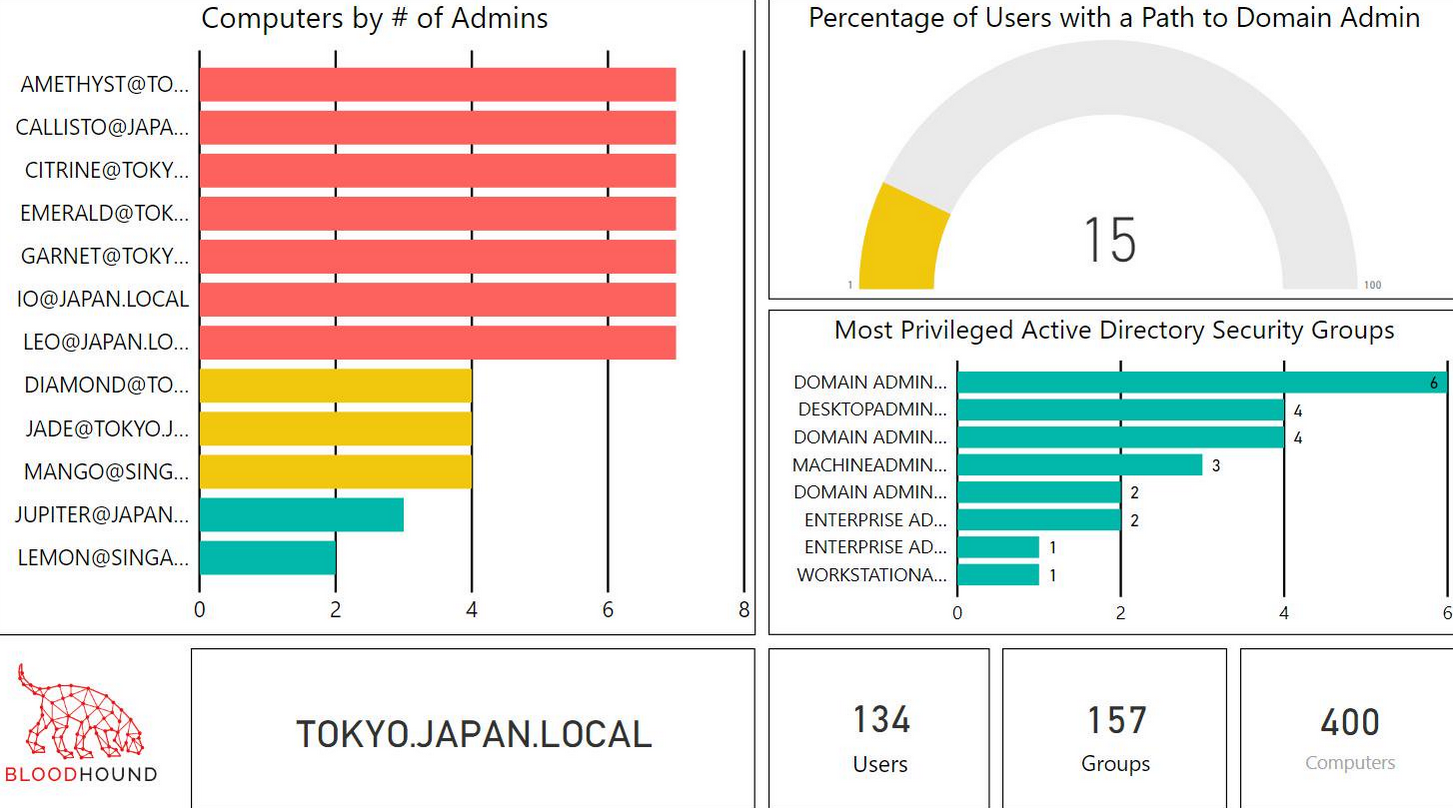
The result is superb and very explicit for management.
Going further
A talk was made at BSides by the three authors in 2016 to introduce BloodHound.
The authors of the tool are also present on the dedicated Slack server. There is a large community present on this Slack ready to welcome you and answer your questions. There is even a #french channel!
BloodHound is not the only tool of its kind. We have a Franco-French tool called AD Control Paths developed by ANSSI. A talk was made during the SSTIC on this subject and the associated PDF is very interesting. French readers, you should read it.
Conclusion
As long as the defense teams think in list and the attackers think in graph, attackers will be one step ahead. This is why BloodHound can also be used as a defense tool. Collect data on a regular basis and prepare some queries to check your Active Directory health/security and monitor its evolution.
To conclude, BloodHound offers a new approach to visualize data in Active Directory environments. Graph visualization makes it possible to understand the complex relationships and intricacies of objects and relationships in the information system in order to identify attack paths and/or abnormal behavior.